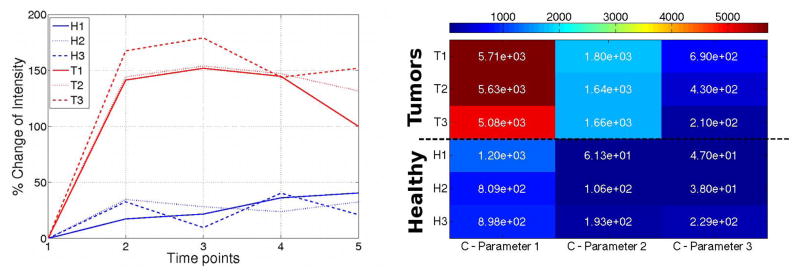
Figure 3.

Time-intensity curves of three voxels in each of the healthy and tumor classes. The corresponding heat map of the parameters of the C matrix is shown on the right. X-axis corresponds to each of the parameters of the C matrix and Y-axis corresponds to the voxel index. Scale factor for C-parameter 1=1, C-parameter 2=1e3, C-parameter 3=1e4
