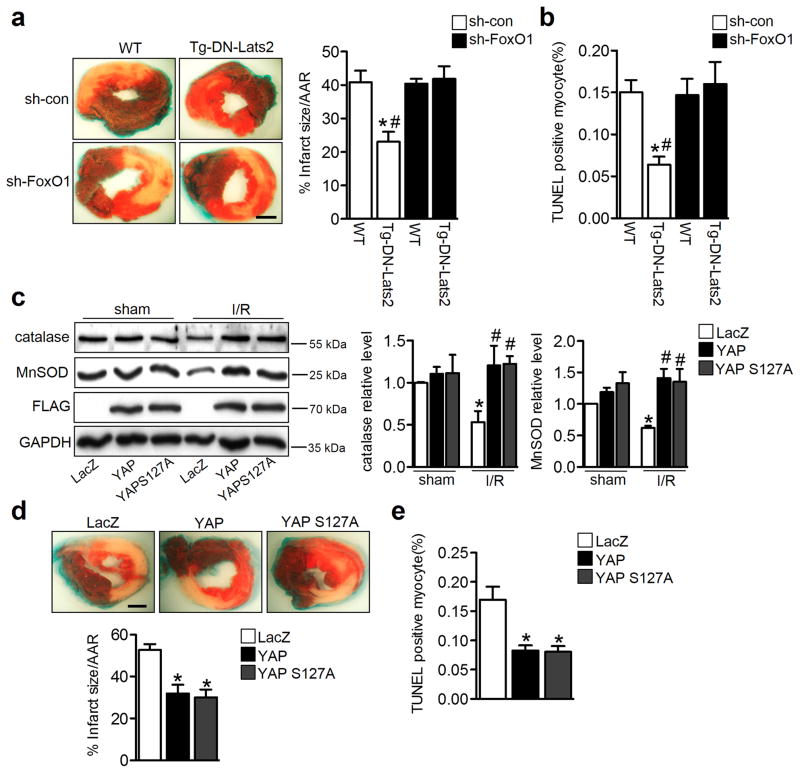
Figure 5. Inhibition of Hippo protects against I/R injury.
a–b, Purified adenovirus (1 × 10⁹ opu) was administered by direct injection to the LV free wall (two sites, 25 μl/site) of Tg-DN-Lats2 and WT mice. I/R surgery was performed 5 days after injection. Mice were subjected to ischemia for 45 minutes followed by 24 hours of reperfusion. a, Gross appearance of LV tissue sections after Alcian blue and triphenyltetrazolium chloride staining demonstrates that injection of ad-sh-FoxO1 abolished the protection observed in Tg-DN-Lats2 mice. Quantitative measurement of myocardial infarct area/area at risk (% infarct size/AAR) was performed (*p<0.05 vs. WT/sh-con, #p<0.05 vs. Tg-DN-Lats2/sh-FoxO1, n=8). Scale bar, 1 mm. b, LV myocardial sections were subjected to TUNEL staining. The number of TUNEL-positive myocytes was expressed as a percentage of total nuclei detected by DAPI staining (*p<0.05 vs. WT/sh-con, #p<0.05 vs. Tg-DN-Lats2/sh-FoxO1, n=5–8). c–e, Purified adenovirus (1 × 10⁹ opu) was administered by direct injection to the LV free wall (two sites, 25 μl/site). I/R surgery was performed 3 days after injection. Mice were subjected to ischemia for 30 minutes followed by 24 hours of reperfusion. c, Sham and ischemic area samples were used for immunoblot analysis for catalase, MnSOD, and GAPDH. FLAG was also used to examine exogenous YAP gene expression. Statistical analyses of densitometric measurements of catalase and MnSOD are shown (*p<0.05 vs. LacZ/sham, #p<0.05 vs. LacZ/I/R, n=5). d, Gross appearance of LV tissue sections after Alcian blue and triphenyltetrazolium chloride staining demonstrates that injection of YAP or YAP S127A decreased the infarct area. Quantitative measurement of myocardial infarct area/area at risk (% infarct size/AAR) was performed (*p<0.05 vs. LacZ, n=8). Scale bar, 1 mm. e, LV myocardial sections were subjected to TUNEL staining. The number of TUNEL-positive myocytes was expressed as a percentage of total nuclei detected by DAPI staining (*p<0.05 vs. LacZ, n=5–6). Data shown as mean±s.e.m.. P values were determined using one-way ANOVA followed by a Newman-Keuls comparison test.

