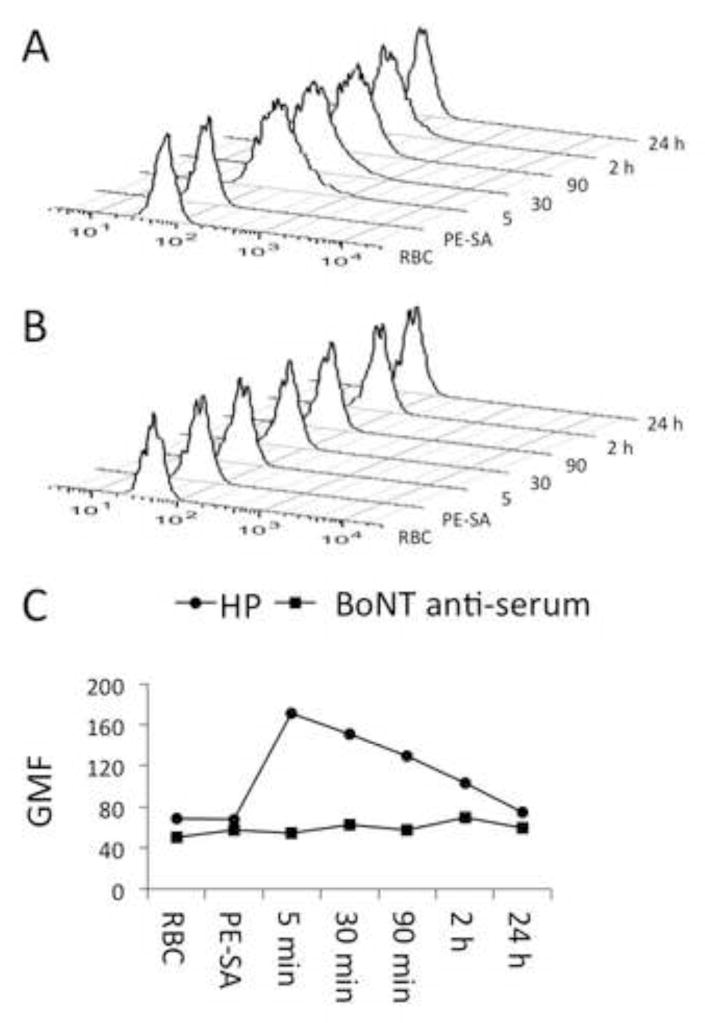
Figure 4.

HP-mediated adherence of BoNT/A to Tg-hCR1 RBCs in vivo. Groups of three Tg-hCR1 mice received intravenous biotinylated recombinant inactive BoNT/A and either the 6A-HP + 4LCA-HP combination (Panel A) or rabbit BoNT anti-serum (Panel B). RBCs were collected at 5, 30, 90 minutes, and 2 and 24 hours following the injection and stained with PE-streptavidin (PE-SA). Histograms show the RBC PE signal over time. Panel C plots the histogram data as geometric mean fluorescence intensity (GMF) (HP RBCs, circles; anti-serum RBCs, squares).
