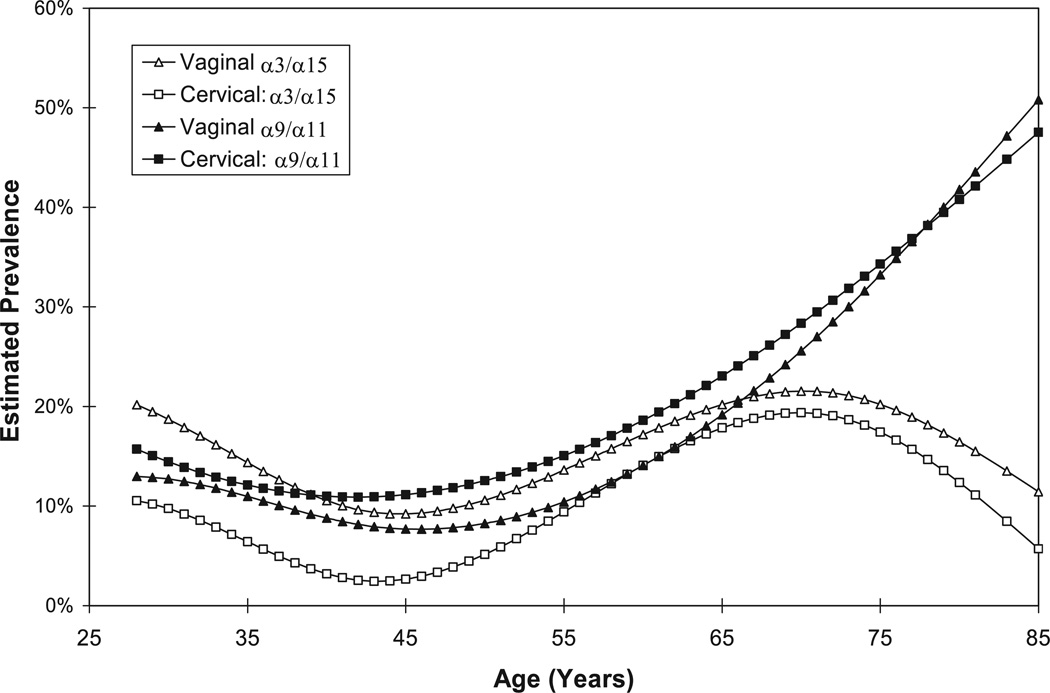
Fig. 1.
A graph of the prevalence of cervical and vaginal α3/α15 and α9/α11 HPV types (adapted from reference 13) by age was fit using a cubic regression spline (see Methods) (cervical, square; vaginal, triangle; α3/α15, open symbol; α9/α11, solid symbol).

