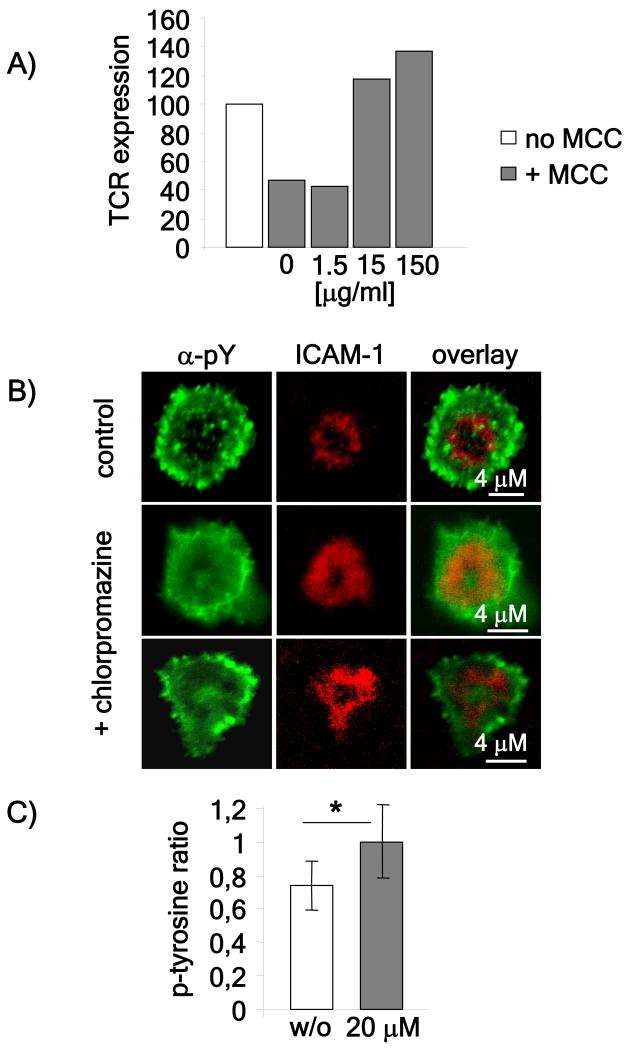
Figure 4. Pharmacological inhibition of TCR downregulation enhances phospho-tyrosine detection in the cSMAC.
A) Rested AND T cells were pre-incubated with the indicated doses of chlorpromazine for 20 minutes and stimulated with un-pulsed or 10 μM MCC-pulsed CH27 cells. To measure TCR downregulation, cell conjugates were disrupted using trypsin-EDTA, stained with anti-Vβ3 and analyzed by flow cytometry for surface TCR expression. TCR expression is shown as the percentage of TCR expression as compared to T cells stimulated with un-pulsed CH27 cells. The data is representative of three independent experiments. B) Rested untreated or chlorpromazine treated (20 μg/ml) AND T cells were flowed on lipid bilayers loaded with 100 μM MCC. After one hour the bilayers were fixed, permeabilized and stained using an antibody to phospho - tyrosine. The images shown are representative of over 50 cells analyzed in three independent experiments. C) Phosphotyrosine staining in the cSMAC and pSMAC of more than 50 cells obtained in three independent experiments was measured using ImageJ software and represented as the ratio between phosphotyrosine staining in the cSMAC as compared to the pSMAC. P values (* < 0.001) were obtained using the Student’s t test.

