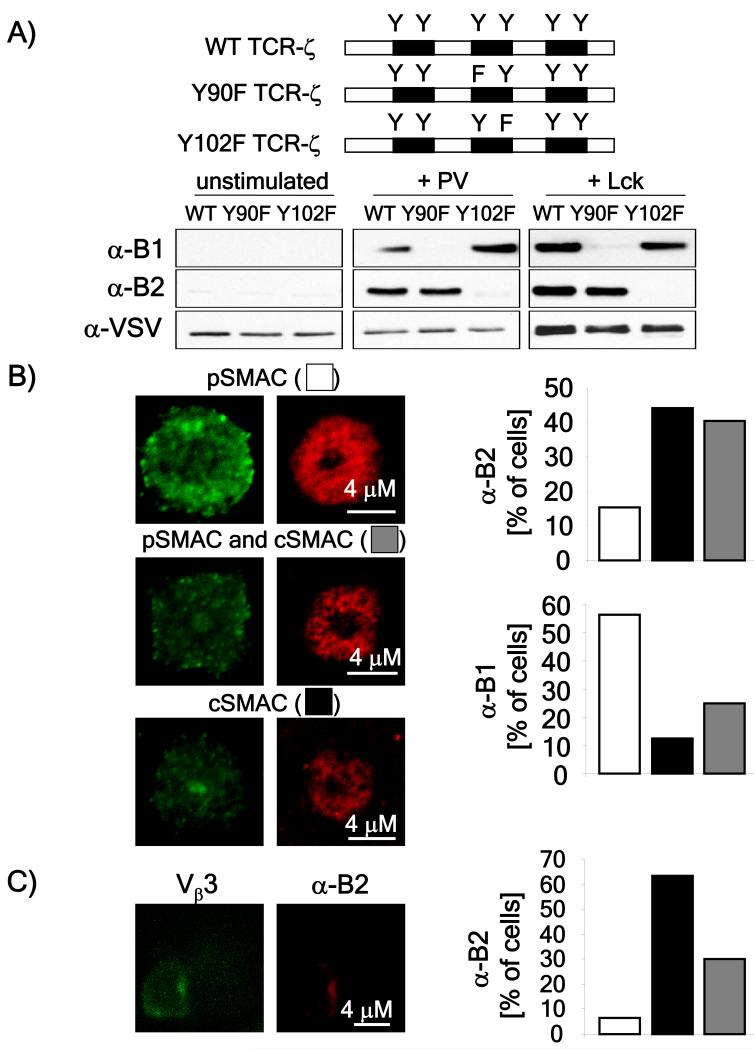
Figure 5. Localization of fully phosphorylated TCR-ζ at the cSMAC.
A) Schematic diagram showing the nomenclature of the six tyrosines in the ζ chain and the position of the B1 and B2 tyrosines that were mutated. HeLa cells, transfected with the indicated ζ chimeric constructs were lysed without stimulation (left panel) or after a 10 minute treatment with pervanadate (middle panel). In the right panel, cells lysates from cells co-expressing the indicated chimeric ζ construct with Lck. Lysates were resolved by SDS-PAGE transferred to nitrocellulose membranes and immunoblotted with the α-B1 and α-B2 rabbit antisera. B) Rested AND T cells were allowed to adhere for 40-60 minutes on planar lipid bilayers loaded with 100 μM of WT MCC peptide. Cells were fixed, permeabilized and stained with α-B1 and α-B2 antisera. Cells were scored and classified into three groups (predominant staining of the cSMAC, pSMAC or relatively even staining between cSMAC and pSMAC). Representative images of pSMAC-dominant; cSMAC-dominant; or both pSMAC and cSMAC dominant staining are shown. Images were quantitated using ImageJ software, in over 20 images obtained in at least two independent experiments, and represented as the percentage of cells showing one of the three patterns of staining” C) AND T cells were stimulated with CH27 cells loaded with the 20 μM MCC peptide for one hour then fixed, permeabilized and stained using anti-Vβ3 and the α-B2 antibody. The image shown is representative of over 40 cells obtained in three independent experiments. The localization on anti-B2 staining was quantified in the cells that formed cSMACs (based on anti-Vβ3 staining) and expressed as the percentage of cells having a pSMAC-enriched (empty bars), cSMAC enriched (black bars) or equally pSMAC and cSMAC enriched (grey bars) B2 staining.

