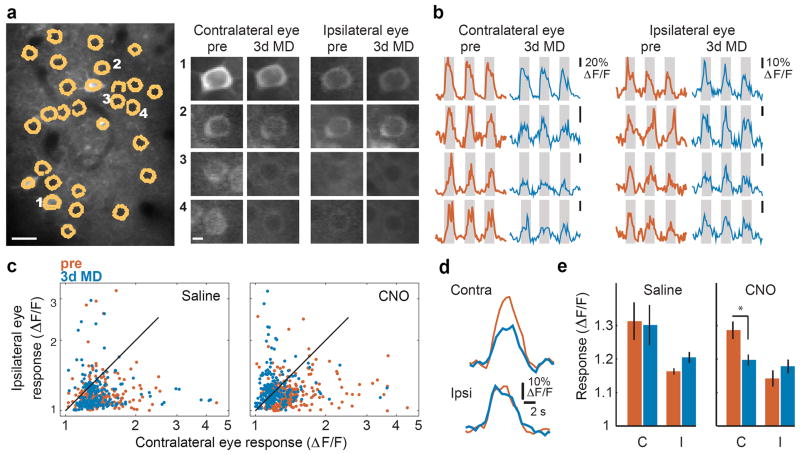
Figure 4. Reducing PV-specific inhibition restores ocular dominance plasticity after the closure of the critical period.
a, In vivo image of GCaMP6 expression, cells outlined in yellow, scale: 20μm. Right, individual cell images (1-4) of the average evoked fluorescence in response to visual stimuli presented independently to the contralateral and ipsilateral eye, before (Pre) and 3 days after MD in a mouse expressing the hM4D DREADD receptor specifically in PV cells, treated with CNO; scale: 5 μm. b, Relative change in fluorescence before and after 3d MD + CNO for cells 1-4 in panel a in response to visual stimulation (gray shading; 5s duration). c, Log-log scatter plot of visually evoked fluorescence response for each cell (saline n= 242 cells; CNO n= 327 cells). Note the significant leftward shift after 3d MD in mice treated with CNO, but not those treated with saline, indicating a reduced response to contralateral eye stimulation after 3d MD. d, Longitudinal ‘optical field potential’ response (average value of all pixels in the entire imaging field, inclusive of neuropil) for the region in panel a. Note the decrease in response to contralateral eye stimulation after MD + CNO that is not seen for the ipsilateral eye. e, Mean ‘optical field potential’ response (Saline n= 4 mice; CNO n=4 mice). * P<0.05.

