Figure 2.
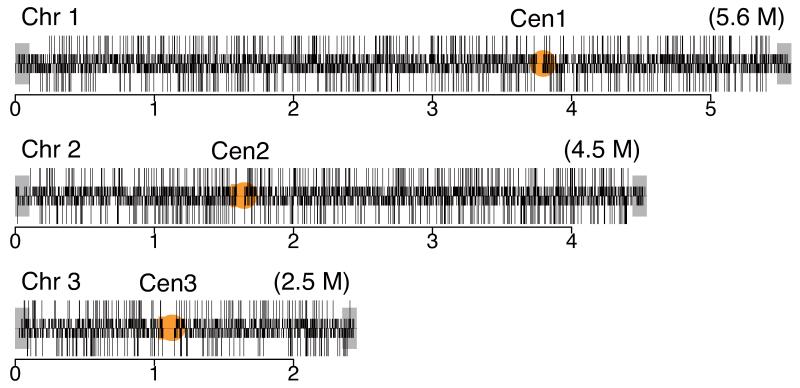
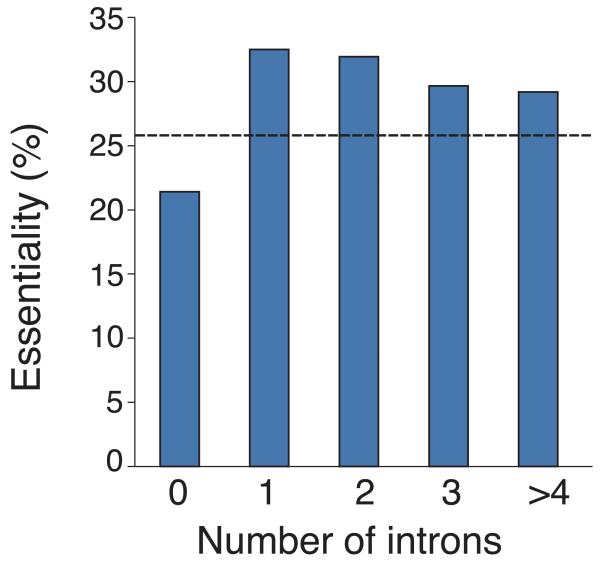
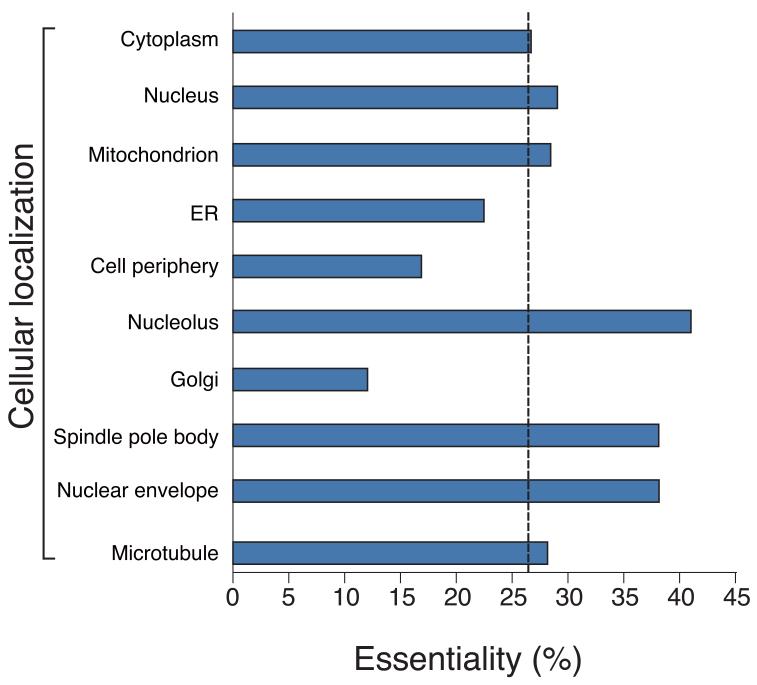
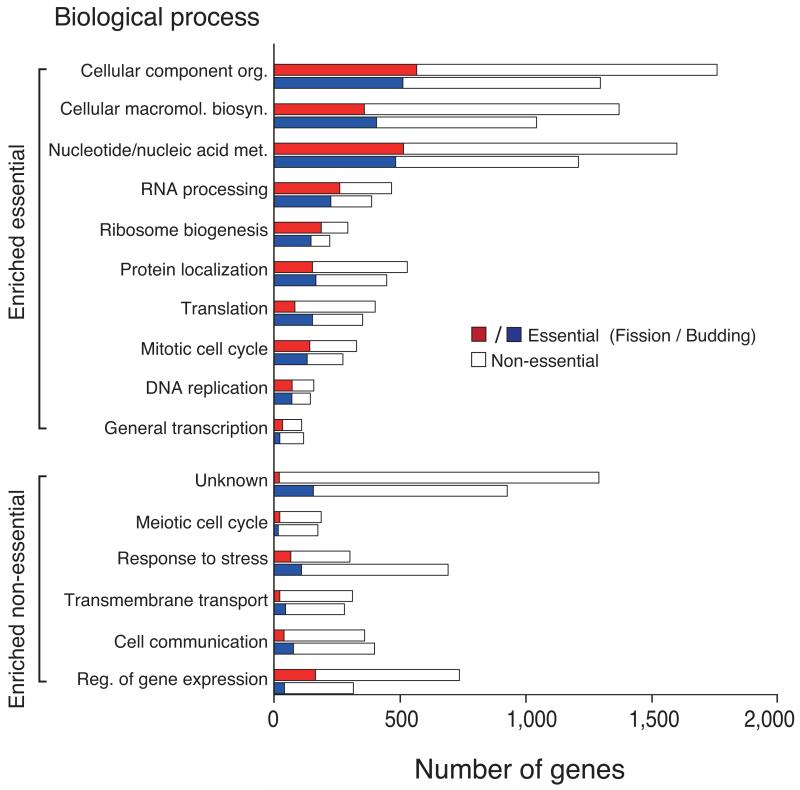
Analysis of gene dispensability. (a) Chromosome distribution of gene dispensability. Essential genes (tall bars) and non-essential genes (short bars) are distributed randomly throughout the genome except within 100 kb of the telomeres (grey boxes) where non-essential genes are enriched. Upper bars represent genes transcribed left to right and lower bars represent genes transcribed right to left. Filled circles in orange represent centromeres. (b) Essentiality vs. number of introns. Gene dispensability was plotted against the number of introns within genes. In fission yeast the essentiality of genes containing introns is significantly (P<10−14) higher than genes lacking introns. The dotted line represents the average essentiality for the total gene set (26.1%). (c) Essentiality vs. ORFeome localization. The percentage of essential genes was plotted against 10 different cellular locations in fission yeast. The dotted line represents the average essentiality for the total gene set (26.1%). The number of essential gene products localised to the nucleolus, spindle pole body, and nuclear envelope is higher than average. The number of essential genes compared to the total for each location is; 1) cytoplasm 564/2,113, 2) nucleus 601/2,068, 3) mitochondrion 128/450, 4) ER 98/436, 5) cell periphery 55/326, 6) nucleolus 89/217, 7) Golgi 27/224, 8) spindle pole body 69/181, 9) nuclear envelope 29/76, and 10) microtubule 20/71. (d) Comparison of GO analysis between fission yeast and budding yeast genes. Bar chart shows a selection of broad, biologically informative GO terms significantly (P≤0.01) enriched for essential and non-essential genes in fission yeast and budding yeast. For the complete list of processes and for methods used to extract this data, see Supplementary Tables 5 and 6. Essential fission yeast genes (red), essential budding yeast genes (blue), non-essential genes (white), y axis (biological processes), and x axis (gene number).


