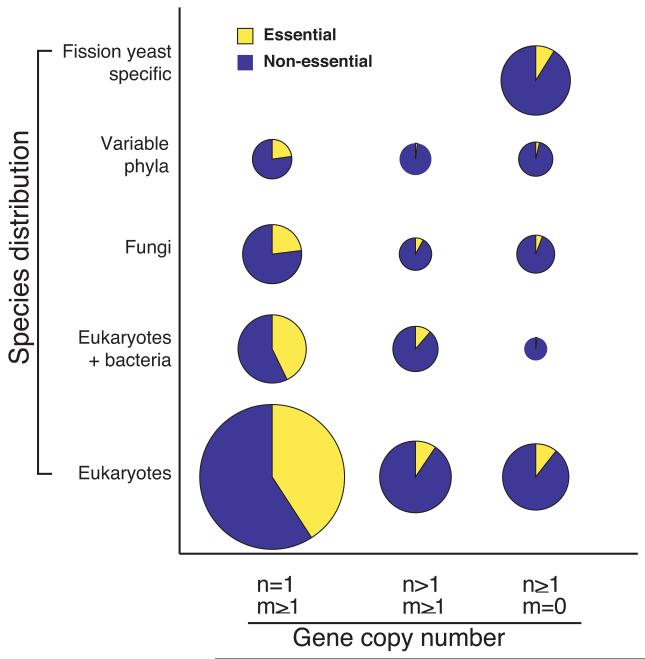
Figure 3.
Comparative analysis of gene dispensability profiles of fission yeast. Gene dispensability profiles of 4,836 deletion mutants by gene copy number of fission yeast orthologues compared to budding yeast (x-axis) and species distribution (y-axis). Compared to budding yeast, fission yeast genes consist of 2,841 single copy genes (n=1, m ≥1), 855 duplicated genes (n>1, m ≥1), and 1,140 genes found in fission yeast but not in budding yeast (n≥1, m=0), where ‘n’ is the number of genes in fission yeast and ‘m’ is the number of genes in budding yeast. The term ‘eukaryotes’ includes human and the term ‘variable phyla’ includes plants. The area of each circle represents the numbers of genes, where essential and non-essential genes are represented by yellow and blue, respectively.

