
Figure 1.
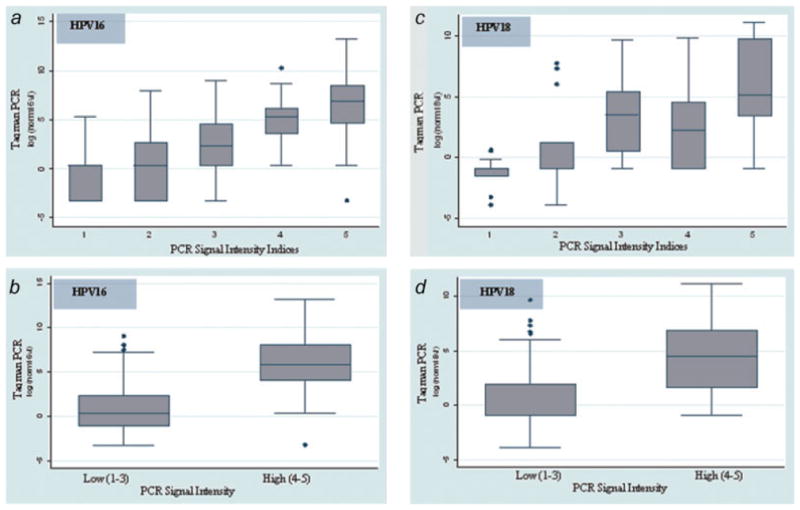
Box plots of log10-transformed HPV16 (a and b) and HPV18 (c and d) normalized viral load (viral load per 20,000 GAPDH copies) by oligonucleotide hybridization signal intensity in the original 5 (a and c) and collapsed 2 (b and d) categories. The median crude HPV copy number (and interquartile range) by hybridization signal intensity, HPV 16: 1 = 10 (1–48), 2 = 6 (1–240), 3 = 144 (27–1661), 4 = 2538 (294–12,610), 5 = 14,382 (2988–61,936); HPV 18: 1 = 2 (1–7), 2 = 221 (1–5682), 3 = 745 (154–6137), 4 = 1387 (172–4881), 5 = 5001 (1803–175,651). [Color figure can be viewed in the online issue, which is available at www.interscience.wiley.com.]