
Figure 1.
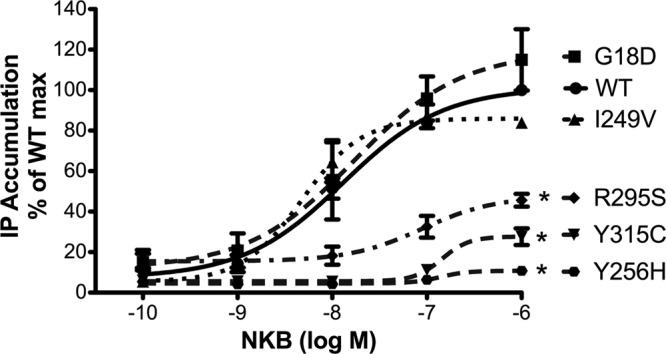
IP accumulation following NKB stimulation is impaired for Y256H, R295S, and Y315C NK3Rs. COS-7 cells were transfected with vectors encoding WT or mutant NK3Rs as indicated and stimulated with increasing concentrations of NKB (10−10 to 10−6 M) for 45 min, after which IP accumulation was measured to generate IP dose-response curves and calculate EC50 values and maximal responses. Data are pooled from ≥3 independent experiments, each performed in triplicate. Results are expressed as percentage of maximal IP accumulation for WT NK3R. Data at each point are shown as means ± se. Significant differences between maximal IP responses were measured using Student's t test. *P < 0.001 vs. WT.