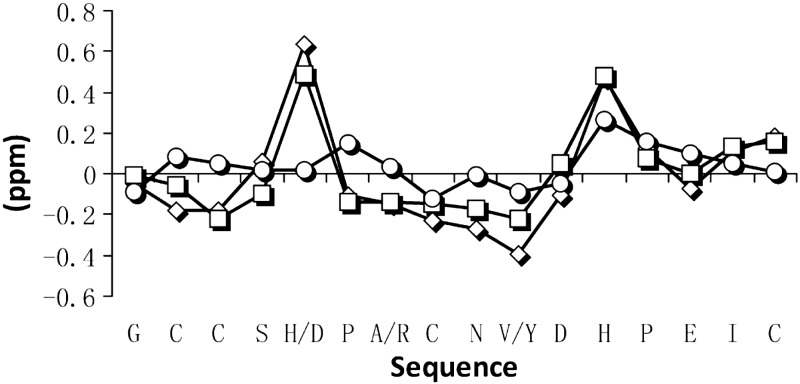
Figure 5.
Secondary shift analysis of α-CTx LvIA conformer 1 (trace with squares), conformer 2 (trace with circles; present study), and Vc1.1 (trace with diamonds; PDB ID: 2H8S) (46). Graph highlights the similarities between the Hα secondary chemical shifts when comparing LvIA to Vc1.1 and showcases the differences between the two conformations of LvIA, with the Hα secondary shift values for the second conformation being close to random coil.

