
Figure 2.
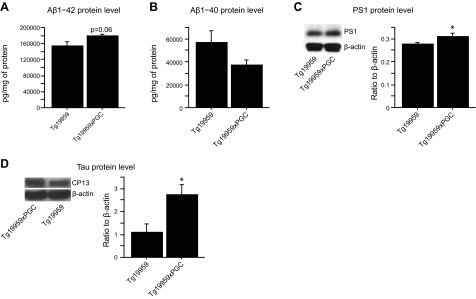
PGC-1α overexpression increased soluble Aβ and tau levels in Tg19959 mice. A, B) Aβ1–42 (A) and Aβ1–40 (B) levels by ELISA in Tg19959 mice (n=6) and Tg19959xPGC-1α littermates (n=6). C) Western blots of PS1 in Tg19959 mice (n=5) and Tg19959xPGC-1α littermates (n=7). D) Western blots of tau using CP13 antibody in Tg19959 mice (n=6) and Tg19959xPGC-1α littermates (n=6). Quantifications are expressed as ratios to β-actin. PGC-1α overexpression resulted in increased Aβ1–42 and CP13 levels in Tg19959 mice. *P < 0.05; unpaired t test.