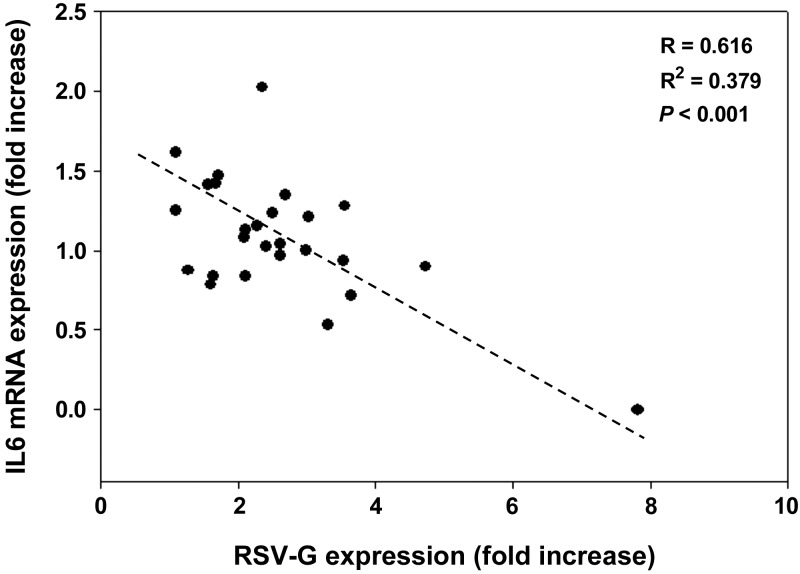
Figure 3.
Correlation between mean RSV-G mRNA expression and mean IL-6 mRNA expression at 48 hpi in 26 lymphoblastoid cell lines from all ethnic panels. Points represent ≥3 biological replicates for each cell line. mRNA was quantified using real-time RT-PCR. Values are normalized to β-actin and expressed as fold change over the respective uninfected control.

