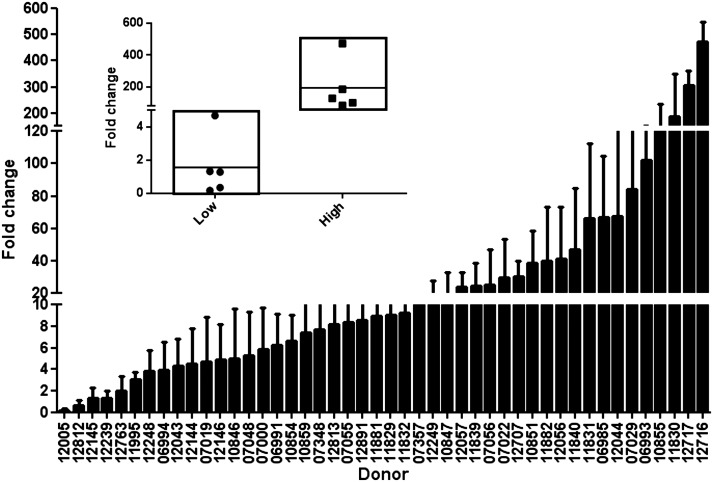
Figure 5.
RSV-G mRNA expression at 72 hpi in 46 CEU HapMap lymphoblastoid cell lines. Data are presented as means ± sem. Inset: box plot of the 5 lowest and 5 highest responding cell lines. mRNA was quantified using real-time RT-PCR. Values are normalized to β-actin and expressed as fold change over a common reference sample.

