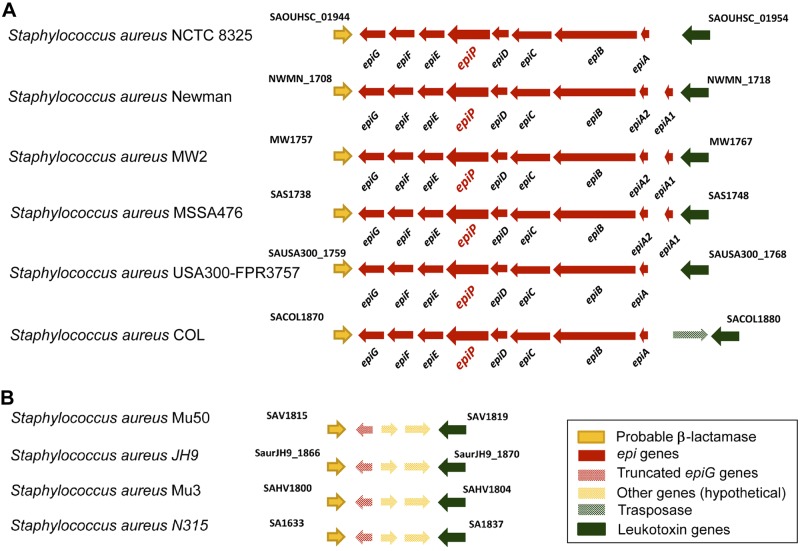
Figure 2.
Schematic representation of the genomic organization of the epi region in S. aureus strains. A) S. aureus strains where epiP is present. B) Corresponding region in strains carrying a truncated epiG gene. Open reading frames are represented as arrows showing the direction of transcription, with the size reflecting the relative length of the genes and the different colors reflecting the gene family.

