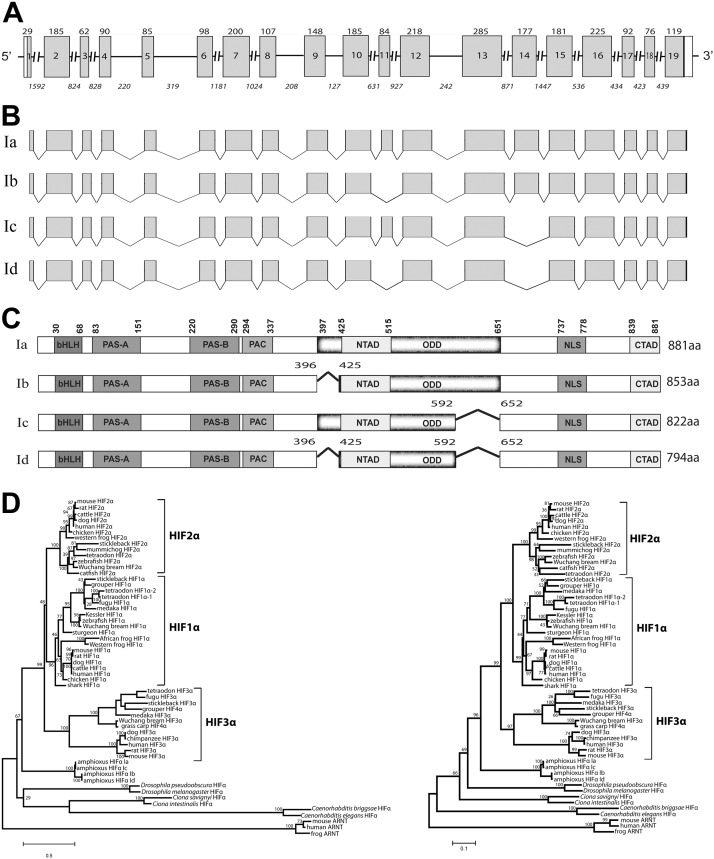
Figure 1.
Characterization of the amphioxus HIFα gene and several alternatively spliced HIFα isoforms. A) Schematic diagram of the amphioxus HIFα gene. Gray boxes represent protein coding regions, open boxes represent untranslated regions, and lines represent introns. Numbers inside the boxes represent the exon number; numbers above each box represent the exon size (bp). Italic numbers below each line represent the intron size (bp). B) Schematic diagram of multiple transcripts identified by RACE and RT-PCR. Note that the exon 11 sequence is not present in transcripts Ib and Id, and exon 14 is absent in Ic and Id. C) Schematic diagram of the amphioxus HIFα isoforms. Numbers in Ib, Ic, and Id represent the position of deletions 1 and 2. Characteristic domains are marked in bold letters according to the amino acid positions of Ia. D) Phylogenetic trees. Full-length amino acid sequences of known chordates and vertebrate HIFα were aligned and analyzed by phyML3.0 with the JTT model for the maximum-likelihood (ML) tree (left). A neighbor-joining (NJ) tree was also constructed with the same dataset by Mega 4 (right). Numbers on the brackets are the bootstrap values with 1000 replications.

