
Figure 1.

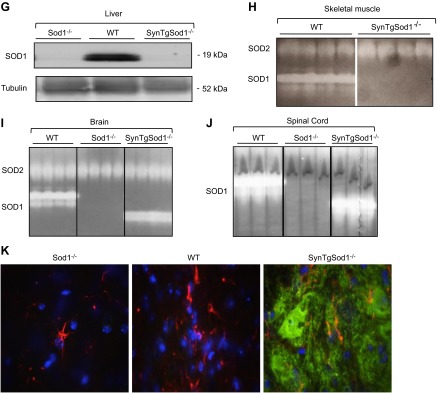
Generation of Sod1 neuron rescue Sod1−/− mice (SynTgSod1−/−). A) Schematic for generating Syn-hSOD1 transgenic mice and breeding to Sod1−/− mice to generate SynTgSod1−/− mice. B, C) Western blot analysis of SOD1 content of the AT (B) and GTN (C) muscles of Sod1−/−, WT, and SynTgSod1−/− mice. D, E) Western blot analysis of SOD1 (D) and SOD2 (E) content of sciatic nerve (SN) of Sod1−/−, WT, and SynTgSod1−/− mice and densitometric quantification of the blots. *P < 0.05 vs. WT. F) Western blot analysis of the SOD1 content of the spinal cord (SC) of WT, Sod1−/−, and SynTgSod1−/− mice and densitometric quantification of the blots. *P < 0.05 vs. WT. G) Representative Western blot of the SOD1 content of the liver of Sod1−/−, WT, and SynTgSod1−/− mice. H–J) Native gels stained for SOD1 and SOD2 enzyme activities in skeletal muscle (H), brain (I), and spinal cord (J) from WT, Sod1−/−, and SynTgSod1−/− mice. K) Transverse sections of lumbar spinal cord dorsal horn from WT, Sod1−/−, and SynTgSod1−/− mice labeled with human SOD1 (green) and GFAP (red), a marker of astrocytes. Nuclei (blue) were labeled with DAPI (×100).