Figure 2.
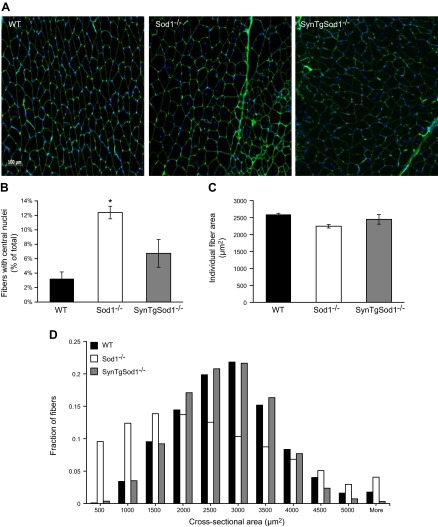
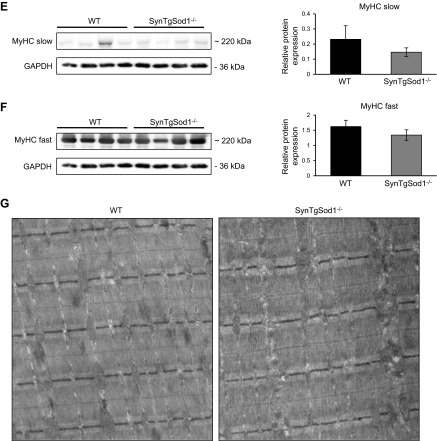
Muscle morphology in SynTgSod1−/− mice. A) Transverse sections of GTN muscles from WT, Sod1−/−, and SynTgSod1−/− mice stained with WGA, to visualize extracellular matrix, and DAPI, to mark nuclei and show fiber sizes and presence of centrally located nuclei. B) Percentage of fibers showing centrally located nuclei. *P < 0.05 compared with values from WT mice. C) Average fiber CSA of GTN muscles from WT, Sod1−/−, and SynTgSod1−/− mice (n=4). D) Frequency distribution of fiber CSA of GTN muscle in WT, Sod1−/−, and SynTgSod1−/− mice (n=4). E, F) Representative Western blots of the slow (E) and fast (F) MyHC content of the GTN muscle of WT and SynTgSod1−/− mice. G) Electron micrographs of GTN muscles from WT and SynTgSod1−/− mice.


