
Figure 3.
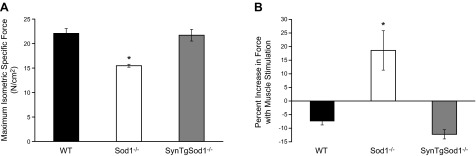
Muscle function in SynTgSod1−/− mice. A) Maximum isometric specific force normalized to total fiber CSA of GTN muscles from WT, Sod1−/−, and SynTgSod1−/− mice at 15 mo of age (n=5). B) Comparison of forces generated during direct muscle and nerve stimulation in GTN muscles of WT, Sod1−/−, and SynTgSod1−/− mice (n=5). Data represent the increase in force generated with direct muscle stimulation expressed as a percentage of the force generated with nerve stimulation. *P < 0.05 vs. WT.