
Figure 5.
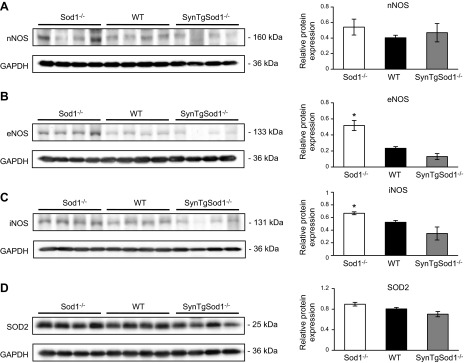
RONS regulatory protein contents in skeletal muscle of SynTgSod1−/− mice. Representative Western blots of nNOS (A), eNOS (B), iNOS (C), and SOD2 (D) protein content of skeletal muscles from Sod1−/−, WT, and SynTgSod1−/− mice and densitometric quantification of the blots. *P < 0.05 vs. WT.