
Figure 8.
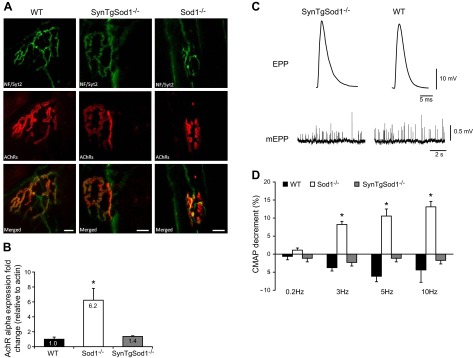
Structure and function of NMJs in SynTgSod1−/− mice. A) NMJ immunofluorescence images from AT muscles of WT, SynTgSod1−/−, and Sod1−/− mice at 8–12 mo of age. Top panels: morphology of presynaptic motor neurons stained with antibodies to neurofilaments and synaptotagmin-2 (green). Middle panels: morphology of postsynaptic AChRs labeled with AlexaFluor 594-conjugated bungarotoxin (red). Bottom panels: merged images of presynaptic motor neurons and AChRs. Scale bars = 10 μm. B) AChR-α mRNA expression in skeletal muscle of WT (n=9), Sod1−/− (n=8), and SynTgSod1−/− (n=6) mice measured by real-time PCR analysis, using γ-actin as the reference gene. Data are normalized to WT values and presented as fold change. C) Representative recordings of evoked EPPs and spontaneous mEPPs in the EDL muscles from WT and SynTgSod1−/− mice. D) Changes in neurotransmission in skeletal muscles (GTN), shown as the percentage decrement in muscle CMAP measured using EMG from WT (n=9), SynTgSod1−/− (n=9), and Sod1−/− (n=10) mice. *P < 0.05 vs. WT.