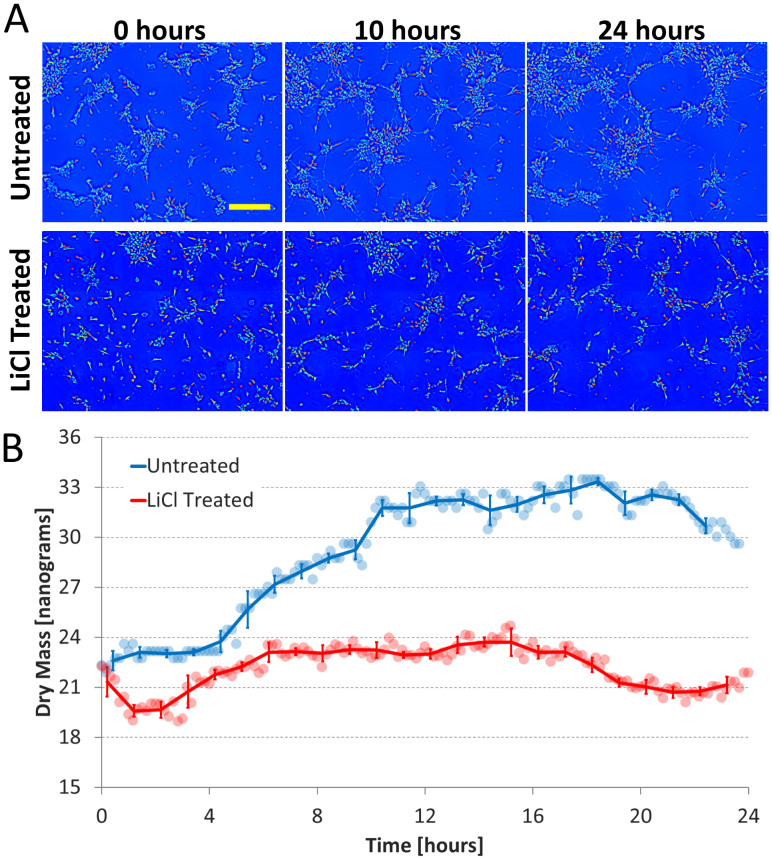
Figure 1.
Dry Mass Growth (A) Dry mass density maps acquired at 0, 10, and 24 hours for both the untreated and LiCl treated cultures; the yellow scale bar corresponds to 200 μm. (B) Total dry mass vs. time of the entire field of view for both conditions. Round markers are raw mass data, solid lines are the average over 1 hour, and error bars indicate standard deviation. For the untreated culture it can be seen that majority of the mass growth occurs between 0 and 10 hours, the time during which the cells are extending processes most actively. In the LiCl treated culture neurite outgrowth is severely retarded and no significant increase in mass is observed during any period.

