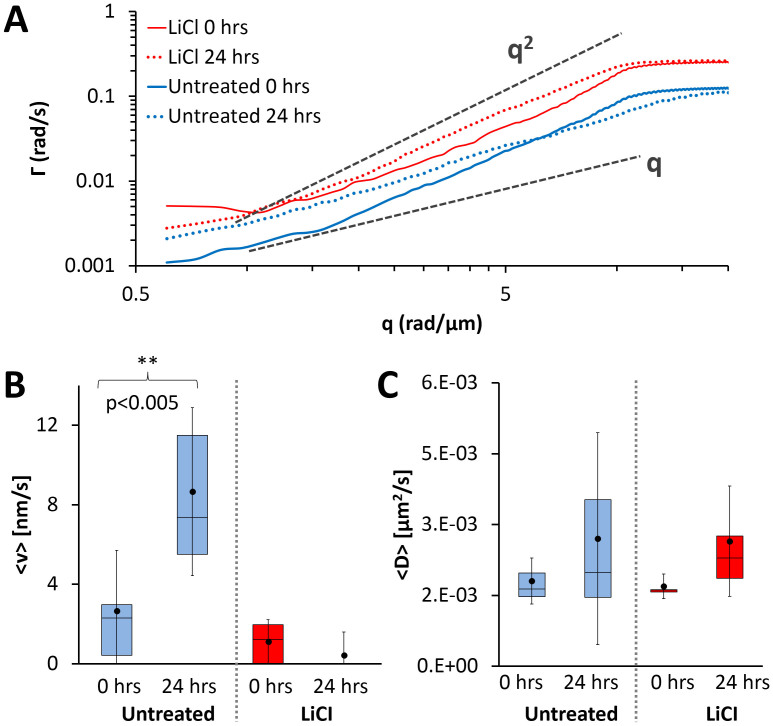
Figure 2.
Mass Transport (A) The average dispersion curve calculated from high resolution movies are shown for both the untreated (blue) and LiCl (red) cultures at 0 (solid lines) and 24 hours (dashed lines); the untreated curves have been offset for clarity. The dashed gray lines indicate a quadratic and linear relationship as labelled. For the untreated culture, a clear shift from a quadratic to a linear relationship can be observed from 0 to 24 hours, whereas for the LiCl culture no shift is observed. (B) Comparison of mean advection velocities obtained from DPS analysis. A statistically significant difference between the mean values at 0 hours and 24 hours is found for the untreated culture, indicating a shift towards more deterministic transport. For the LiCL treated culture there is a slight decrease in the mean advection velocity over 24 hours. (C) Comparison of mean diffusion coefficients obtained from DPS analysis. There is no statistically significant difference between 0 hours and 24 hours for both conditions, however there is an increase in the range of the measured values. The whiskers indicate one standard deviation above and below the mean (black dot).

