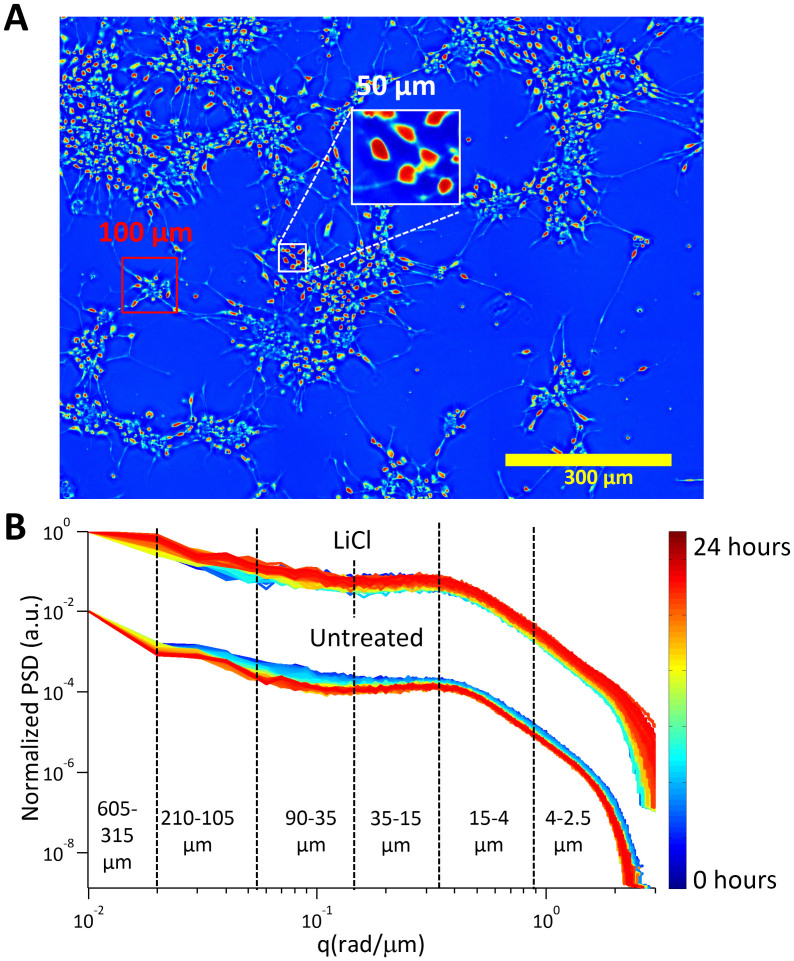
Figure 3.
Angular scattering analysis (A) Dry mass density map of the untreated culture at 24 hours. Various spatial scales have been labeled to aid in the interpretation of the angular scattering maps. (B) Radially averaged profile plots of the angular light scattering map from each time point in the data for both LiCl treated and untreated cultures. The plots are color coded as shown in the color bar. The dashed lines and corresponding labels indicate the various spatial ranges according to which the profiles were split. For the untreated culture, the slopes in each region change with time, with the greatest changes occurring at the spatial scales corresponding to the size of the clusters, the inter cluster distance and inter-soma distance. No such change can be observed in the LiCl treated culture.

