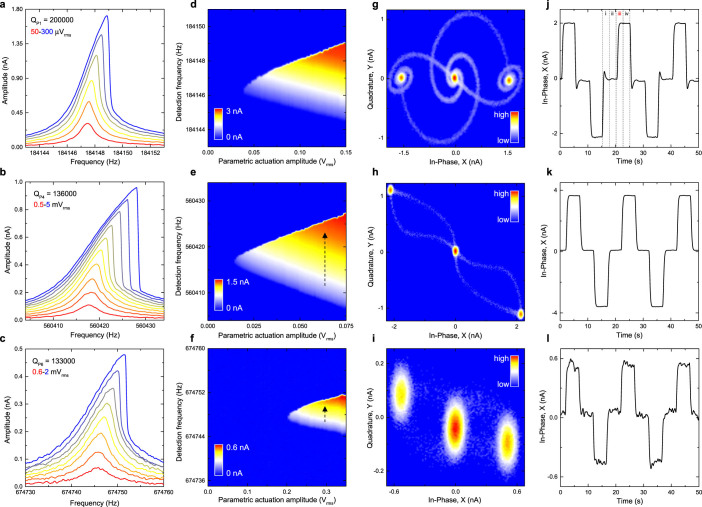
Figure 2. The harmonic and parametric resonance dynamics of modes P1, P4 and P6.
(a–c), The harmonic response of modes P1, P4 and P6 as a function of actuation amplitude. (d–f), The parametric response of the same modes as a function of the actuation amplitude measured in a subharmonic detection configuration. (g–i), The stability diagrams indicate the occupation probabilities of the parametric resonances in phase space and are measured with parametric actuation amplitudes and frequencies of 0.1 Vrms and 368294 Hz, 0.05 Vrms and 1120834 Hz, 0.3 Vrms and 1349496 Hz for modes P1, P4 and P6 respectively. The resultant phase portraits indicate that when the parametric actuation is activated, each mode evolves from its stationary state which is indicated by the high probability lobe at the origin, to one of the two available oscillating states, that again can be identified by the high probability lobes at finite amplitudes, where the 2 oscillating states always exhibit a π radians phase separation. In addition the stability diagrams also reveal that only a single trajectory from the stationary state to each oscillating state is possible which is different to the single trajectory from each oscillating state to the stationary state54. (j–l), Using the pulse sequence outlined in Fig. 1c, binary information can be written, stored and erased in the bi-stable oscillation states of the parametric modes20,45. The resultant periodic switching corresponds to sequentially moving between the lobes of the oscillating states via the stationary state in the phase portraits detailed in Figs. 2g–2i.

