
Figure 6.
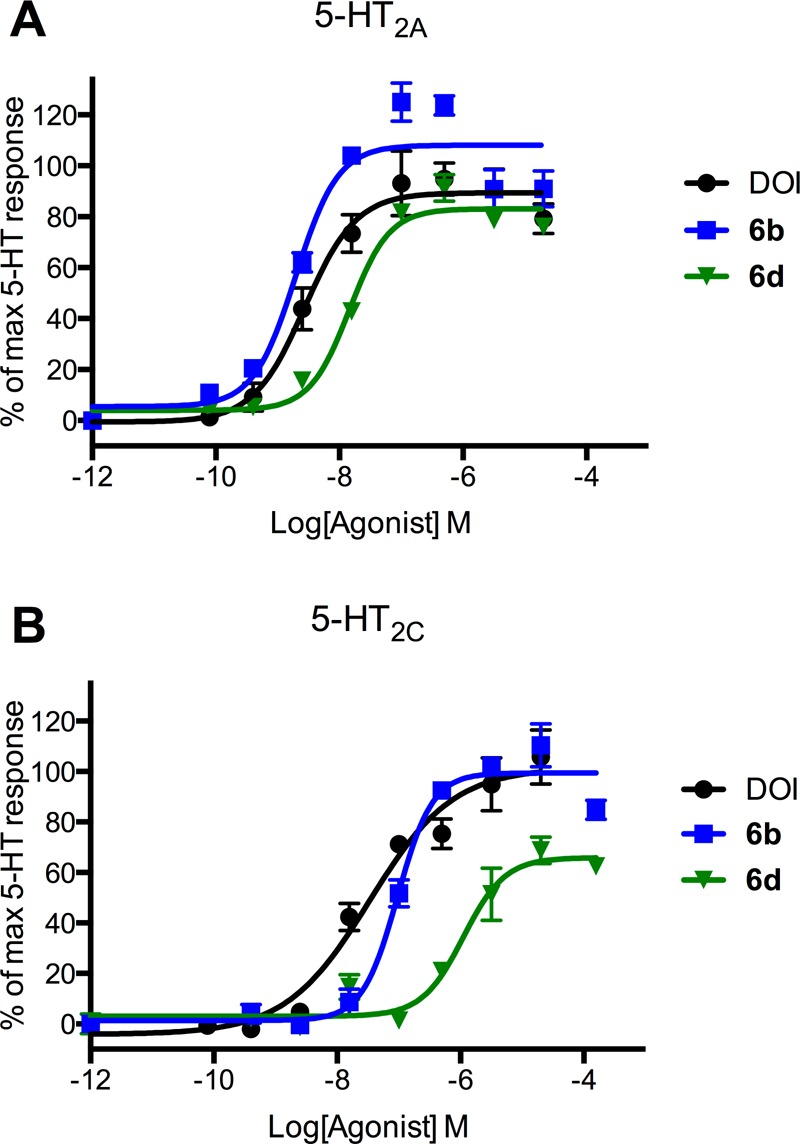
Concentration–response curves of the agonists DOI, 6b and 6d at 5-HT2A (A) and 5-HT2C (B) receptors, respectively. Concentration–response curves were generated from stimulation of inositol phosphate formation in tsA cells transiently expressing either 5-HT2A (A) or 5-HT2C (B) receptors. The formation of inositol phosphate was determined as described in Methods and calculated as percent response compared to a full 5-HT response. Data shown are mean ± SD of a single representative experiment performed in triplicate. Two additional experiments gave similar results.