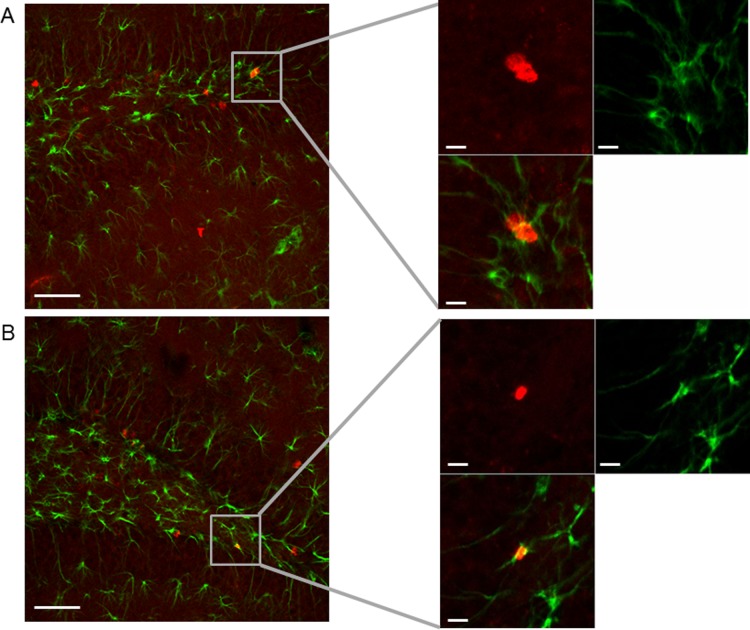
Figure 5.
Fluorescence micrographs. GFAP (green) and BrdU (red) immunostaining is shown exemplarily for an animal from the nonkindled group treated with the control peptide (A) and for an animal from the kindled group treated with the control peptide (B). No difference was evident among all treatment groups either in the number of GFAP-positive cells or in the number of BrdU/GFAP-positive cells. Scale bar is 5 μm in high magnification micrographs and 50 μm in the rest of the images.

