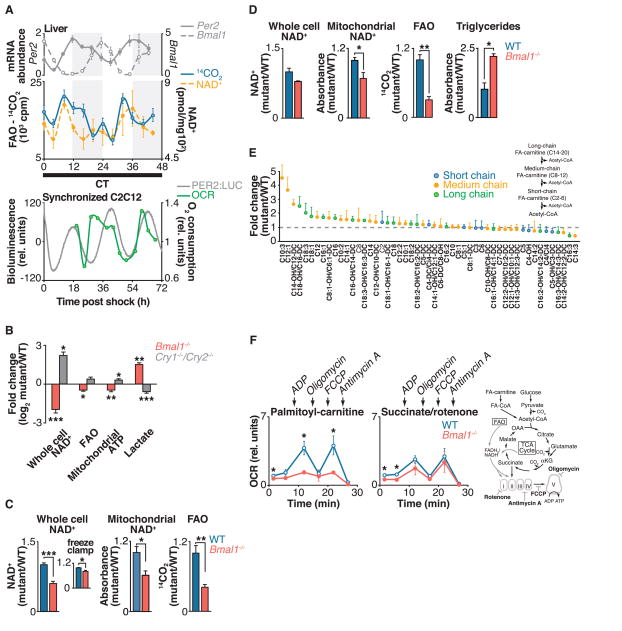
Fig. 1. Circadian clock control of mitochondrial oxidative function.
(A) Top: Liver FAO and NAD+ were measured every 4 hours for 48 hours in fasted wild-type mice kept in constant darkness. Shading indicates where light and dark periods would normally occur under 12:12 light-dark conditions. Relative mRNA expression of Per2 and Bmal1, as measured by qPCR, is shown above for reference to circadian phase (n = 4 per time point). Bottom: Relative oxygen consumption rate (OCR) in synchronized C2C12 cells, with PER2::LUC bioluminescence shown for reference to circadian phase (n = 1 per time point). (B) Relative amounts of NAD+, FAO, mitochondrial ATP (in galactose-containing media), and lactate (in glucose-containing media) in Bmal1−/− and Cry1−/−;Cry2−/− MEFs compared to wild-type (WT) controls (n = 6). (C and D) Relative whole-cell and mitochondrial NAD+, FAO, and triglycerides in liver from fasted Bmal1−/− liver compared to littermate controls at (C) ZT0 (n = 4 to 9) and (D) ZT12 (n = 3 or 4). Inset in (C): Relative NAD+ from freeze-clamped liver tissue (n = 5). (E) Acyl-carnitine profile in liver of Bmal1−/− mice compared to WT (n = 3). (F) OCR in mitochondria isolated from liver of fasted WT and Bmal1−/− mice in the presence of palmitoyl-carnitine or succinate plus rotenone treated sequentially with ADP, oligomycin, FCCP, and antimycin A at ZT0 (n = 3 or 4). Schematic shows FAO and TCA cycle pathways, and indicates both OCR substrates and metabolic inhibitors used to evaluate mitochondrial function in circadian mutants. *P < 0.05, **P < 0.01, ***P < 0.001 for Student’s two-tailed t test comparing single time points between WT and mutant averages. Data are represented as average ± SEM.

