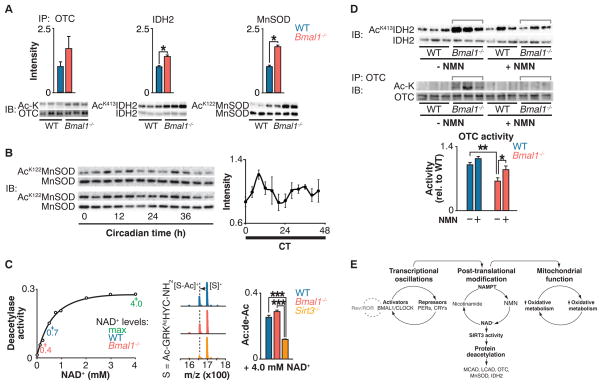
Fig. 3. Circadian regulation of SIRT3 activity.
(A) Immunoprecipitation of OTC followed by acetyl-lysine and anti-OTC blotting (left); IDH2 Lys413 and total IDH2 blotting (center); and MnSOD Lys122 and total MnSOD blotting (right) in liver from fasted WT and Bmal1−/− mice at ZT0. Quantitation of acetylated protein is normalized to the amount of the target protein. (B) MnSOD Lys122 acetylation and total MnSOD in liver measured every 4 hours for 48 hours in fasted wild-type mice kept in constant darkness. Quantification of acetyl-Lys122 MnSOD normalized to total MnSOD. (C) Left: In vitro deacetylase activity of recombinant SIRT3 with acetylated SIRT3-selective target peptide (S) in the presence of increasing concentrations of NAD+. Center and right: Representative shift in mass/charge ratio (m/z) and quantification of SIRT3 deacetylase activity (Ac:de-Ac) in liver from fasted WT, Bmal1−/−, and Sirt3−/− mice at ZT0 incubated with 4 mM NAD+ (n = 3). (D) Top: Western blots showing IDH2 Lys413 acetylation and IDH2 from livers of fasted WT and Bmal1−/− after injection with a single dose of saline or NMN 12 hours before ZT0 collection. Bottom: Relative OTC acetylation and OTC activity in livers of WT and Bmal1−/− mice that had been fasted after injection with NMN for 10 consecutive days. (E) Model of circadian regulation of NAD+-mediated mitochondrial oxidative function through SIRT3. *P < 0.05, **P < 0.01, ***P < 0.001 for Student’s two-tailed t test comparing single time points between WT and mutant averages. Data are represented as average ± SEM.

