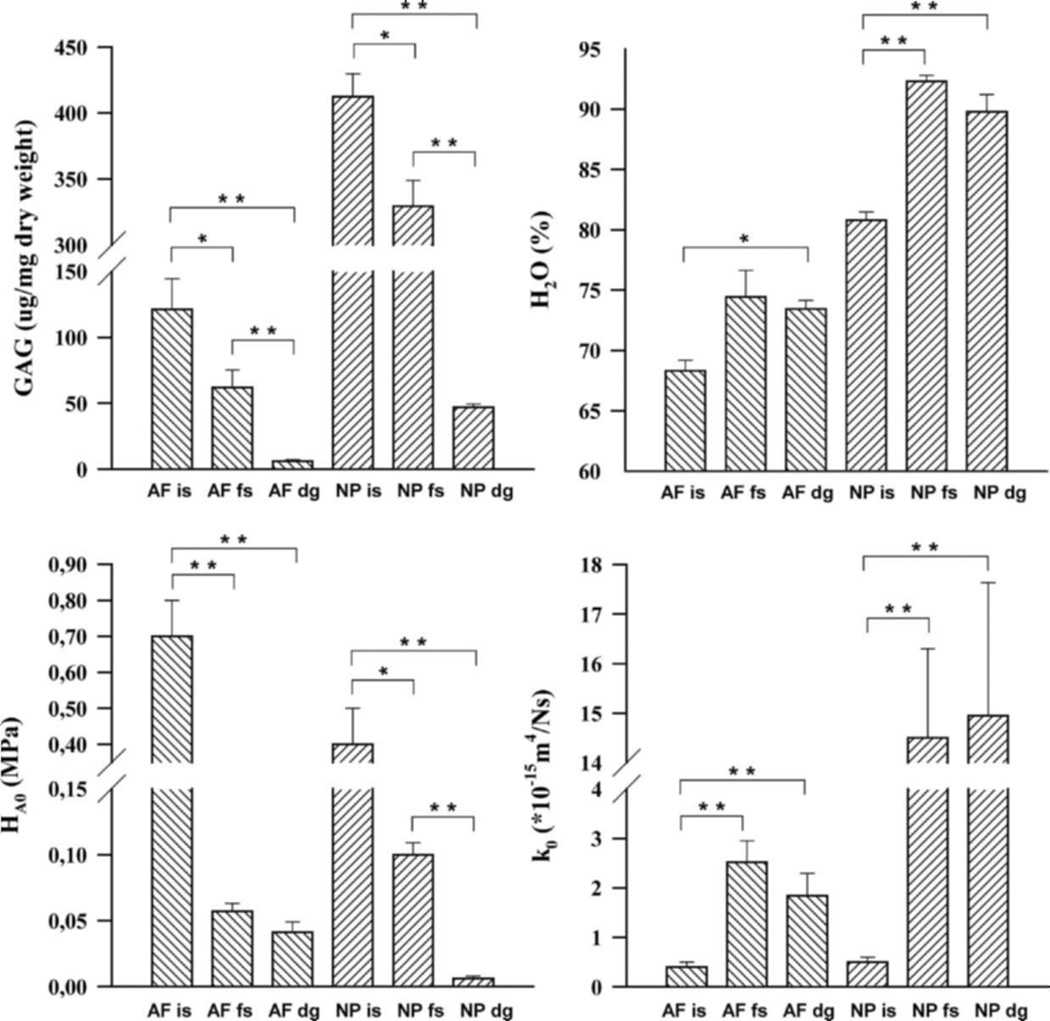
Figure 3.
Mean ± SEM water content (%), GAG content (µg/mg dry weight), compressive modulus (MPa), and hydraulic permeability (*10−15m4N−1s−1) for the in-situ (is), control free-swelling (fs), and digestion (dg) groups for both annulus (AF) and nucleus (NP). Significant differences between the experimental groups were indicated by *p < 0.05 or **p < 0.0001. Annulus and nucleus groups were not compared.

