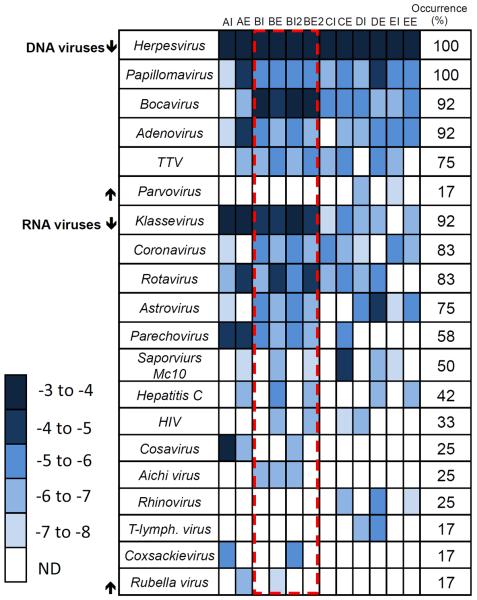
Figure 2.
Heat map demonstrating the relative abundance and occurrence for human viral pathogens. Relative abundance is defined as the log10[reads mapped to a virus contig divided by the total reads in the sample]. The dashed box represents replicated samples. Tables S3 and S4 provide virus identification to the highest taxonomic level.

