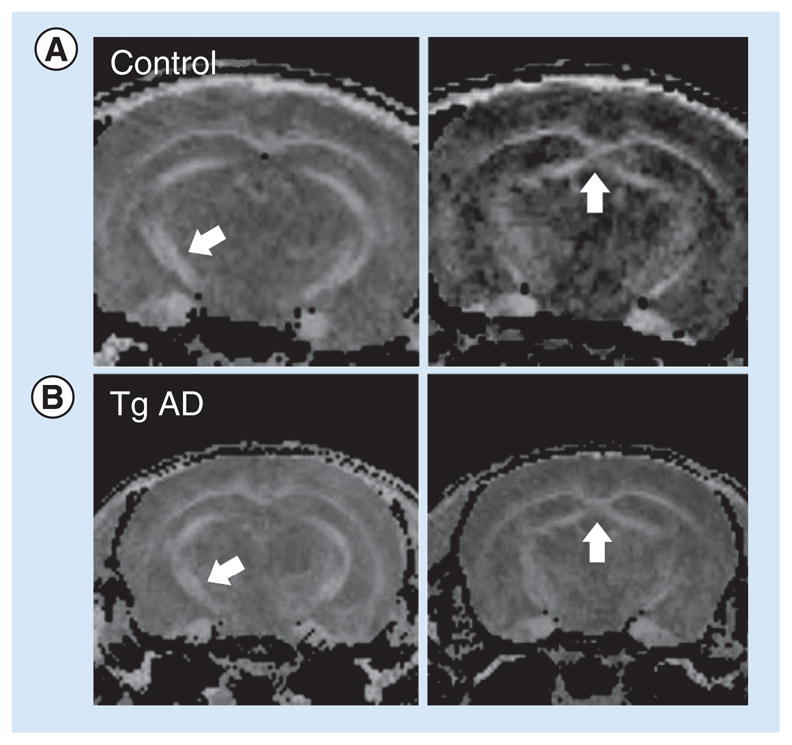
Figure 4. Four MRI–diffusion tensor imaging images of the mouse brain.

(A) Shows the normal mouse and (B) shows the Tg AD mouse model at 6 months of age. Arrows indicate areas with changes in fractional anisotropy between normal and Tg AD model mice; in other words, the fornix and perforant path. The fractional anisotropy has been reduced by 20% in the AD mice.
AD: Alzheimer’s disease; Tg: Transgenic.
