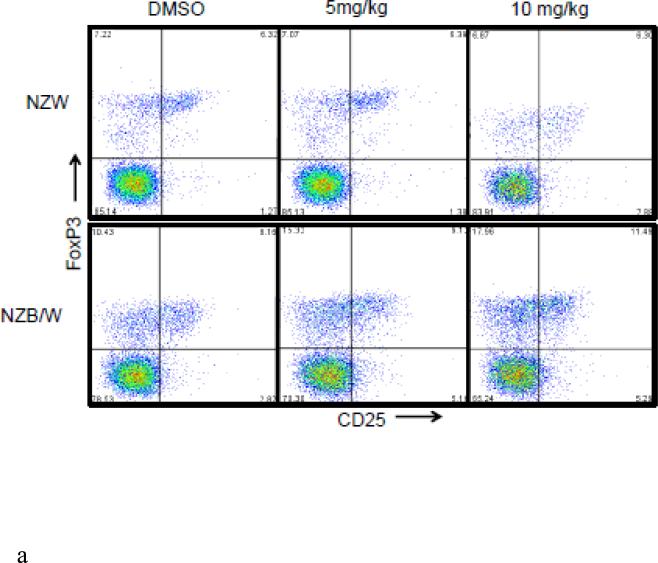
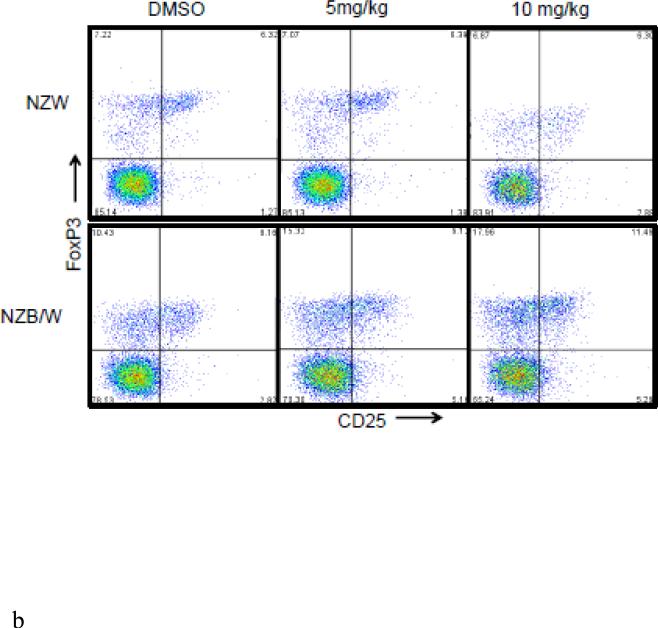
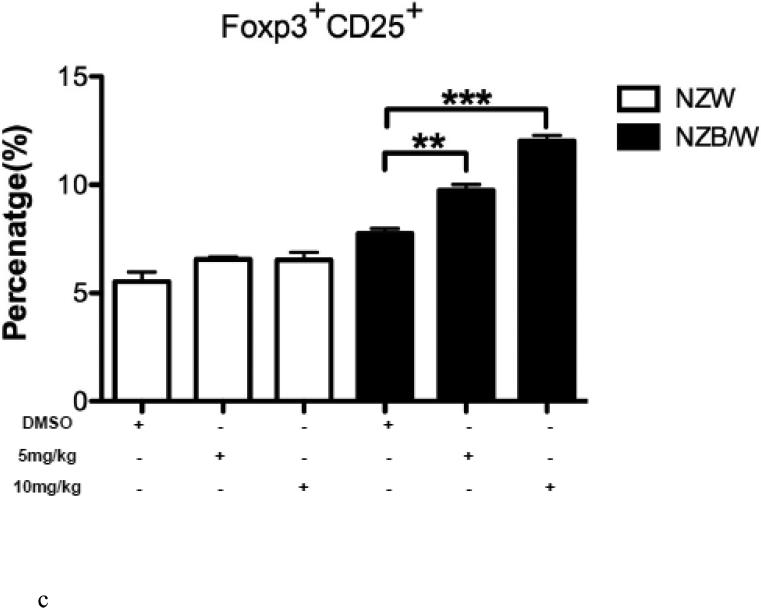
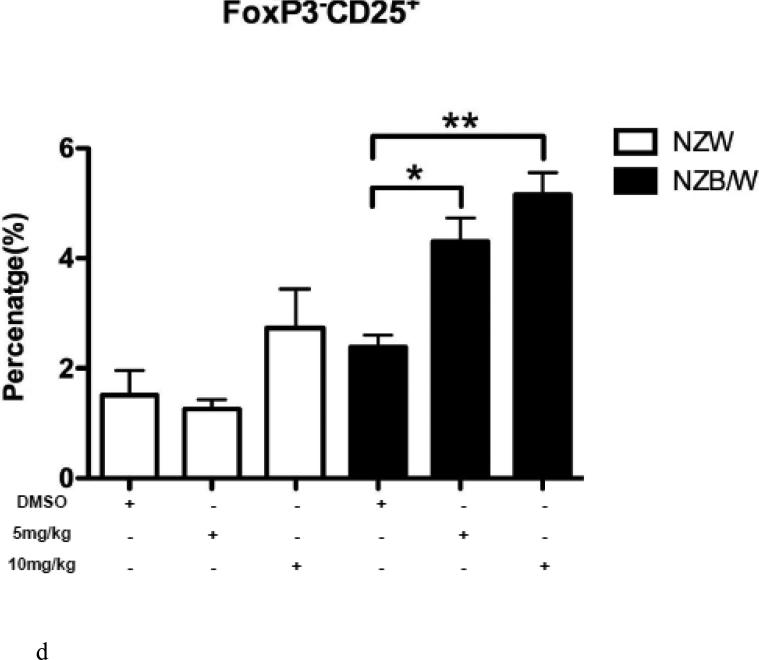
Figure 6. The Treg cell profile was increased following class I and II HDAC inhibition.
(A) Representative images of flow cytometry Treg profiles. (B) ITF2357 (10 mg/kg) treatment significantly increased the percentage of CD4+CD25+Foxp3+ T cells. (C) Percentage of T cells gated on CD4 that were Foxp3+CD25− in NZW and NZB/W mice treated with ITF2357(5 mg/kg in DMSO), (10 mg/kg in DMSO) or vehicle control (DMSO) for 16 weeks. (D) The percentage of CD25+ T cells is significantly increased following ITF2357 treatment in 38 week old mice (n ≥ 5; *p < 0.05, **p < 0.005).

