
Figure 1.
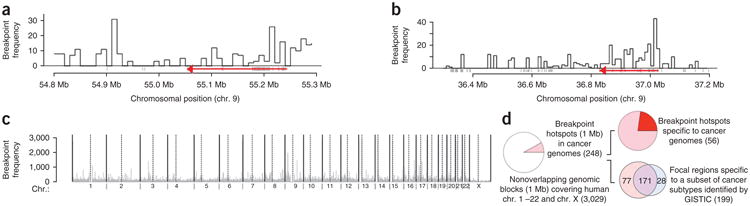
Spatial distribution of breakpoint hotspots in cancer genomes and genomes of healthy human subjects. (a) SCNA breakpoints can occur at high frequencies tens of kilobases away from EGFR (a known cancer gene shared across multiple cancer subtypes), shown in red. The direction of the red arrow shows the direction of transcription of EGFR. (b) SCNA breakpoints can occur at high frequency tens of kilobases away from PAX5 (a known cancer gene specific to acute lymphoblastic leukemia), shown in red. The red arrow shows the direction of transcription of PAX5. (c) SCNA breakpoint densities calculated over 1-Mb nonoverlapping genomic blocks across the human genome. Dotted vertical lines mark centromeres. (d) Summary statistics for SCNA breakpoint hotspots. Frequencies are shown in parentheses.