
Figure 3.
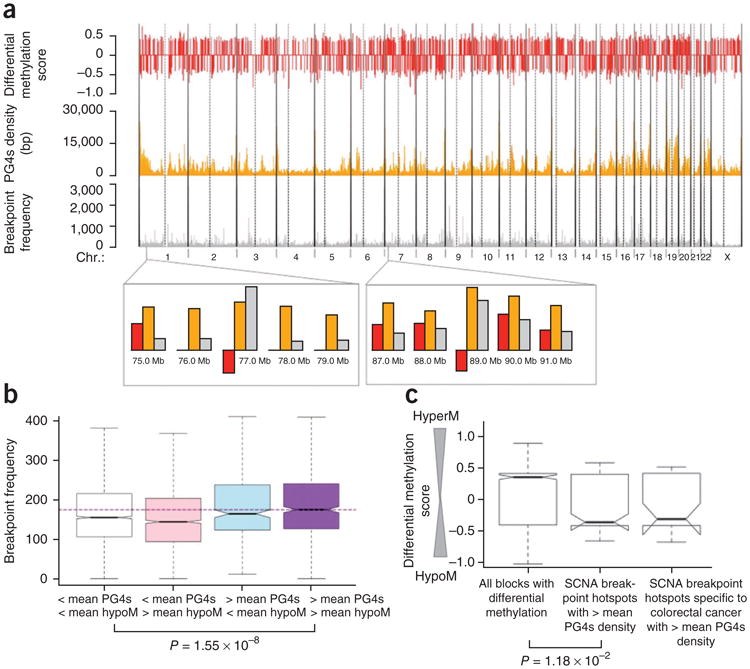
Role of G-quadruplex structures in the generation of breakpoint hotspots. (a) Extent of differential methylation in colon cancer relative to normal colon (red), density of G4 sequences (orange) and density of DNA breakpoints in cancer (gray) are shown across the human chromosomes. Vertical dotted lines mark centromeres. A negative value of differential methylation indicates differential hypomethylation. (b) The density of DNA breakpoints in cancer is higher in genomic blocks that have both above-average hypomethylation and above-average PG4s density than that in genomic blocks that do not have above-average representation of either of the factors. The purple horizontal dashed line shows the median breakpoint density corresponding to the rightmost group. The whiskers of the box plots represent the range of the breakpoint frequencies for the respective groups. (c) SCNA breakpoint hotspots with above-average PG4s density are significantly differentially hypomethylated (low differential methylation score) relative to the genome-wide background. SCNA breakpoint hotspots specific to colorectal cancers with above-average PG4s density show a similar trend (P value > 0.05 because there are fewer data points).