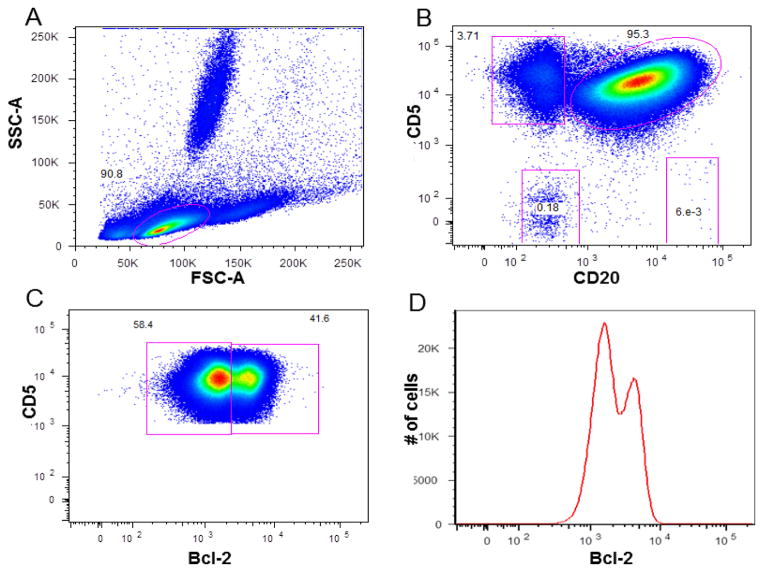
Figure 5. Bimodal Bcl-2 expression in CLL.
A: is the FSC-A vs. SSC-A gating on lymphocytes. B: Dot plot CD20 vs. CD5 gated on Lymphocyte (T-cells, Clone, NK-cells, and normal remaining polyclonal B-cells (NB) gates are shown). C: Dot plot Bcl-2 vs. CD5 gated on CLL clonal cells showing the bimodal Bcl-2 expression whereas, about 40% showing bright Bcl-2 expression and about 60 % is showing dim expression. D: Single color histogram showing bimodal Bcl-2 expression in CLL clonal cells.

