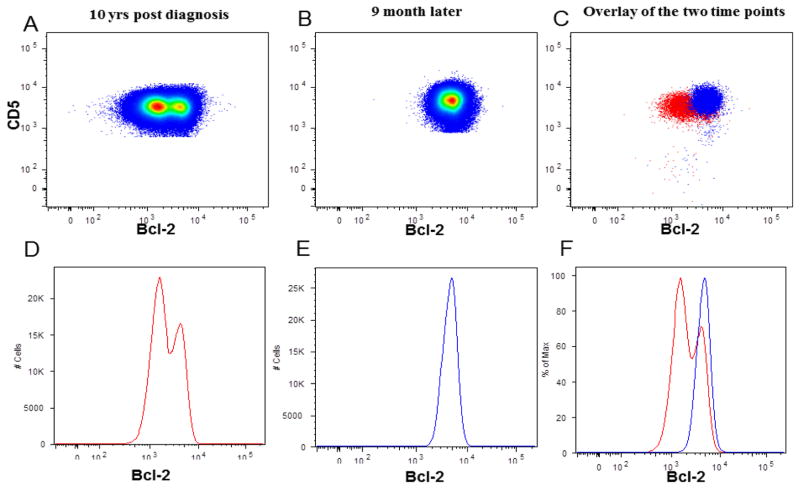
Figure 6. Correlation between Bcl-2 expression and 13q14 status in two different time points.
A, B, and C: Dot plots of BCl-2 vs. CD5 showing Bcl-2 expression in two different time point in the same case. A: Dot plot showing bimodal Bcl-2 expression in the 1st time point (10 years from diagnosis). B: Dot plot showing the uni-modal Bcl-2 expression in the second time point 9 month later. C: is the overlay of Bcl-2 expression for the two time points. D, E, and F: single color histogram showing the bimodal expression of Bcl-2 in A, uni-modal Bcl-2 expression in B, and the overlay in C.

