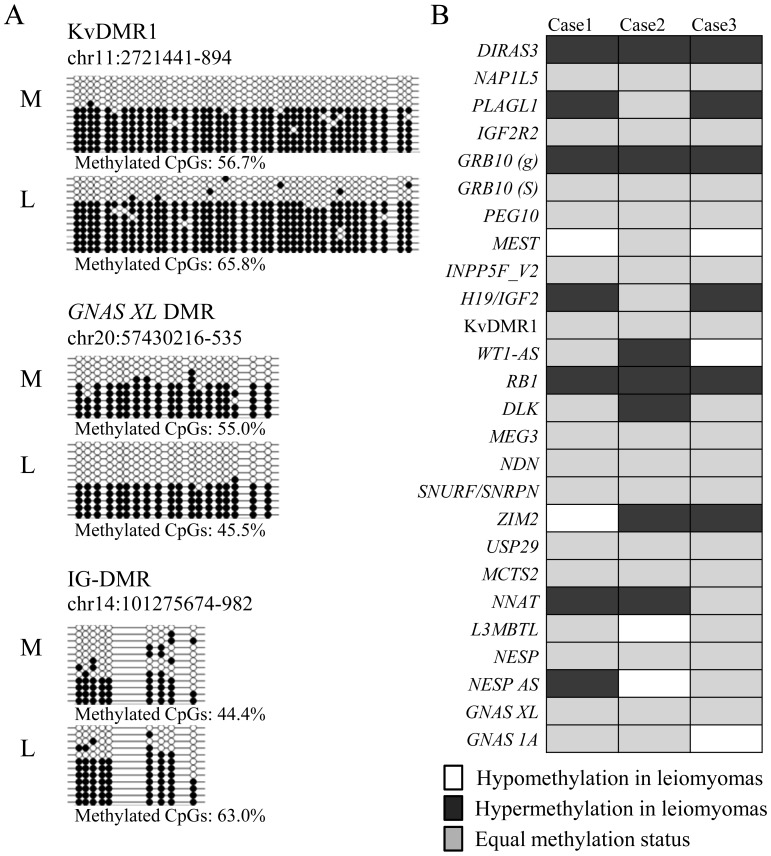
Fig. 1.
Methylation status of imprinted differentially methylated regions (DMRs) in the leiomyoma and myometrium. A: Methylation analysis of the KvDMR1, GNAS XL DMR and IG-DMR by bisulfite sequencing in the leiomyoma and myometrium. The genomic position of each DMR indicates the region analyzed by bisulfite sequencing. Open and filled circles indicate the unmethylated and methylated CpG sites, respectively. Each horizontal line represents an individual clone. L and M in each case denote the leiomyoma and adjacent myometrium, respectively. Methylated CpGs represent the overall methylation percentage for each DMR (the number of methylated CpGs per number of total CpGs) in each specimen. B: The HumMeth450 data of three cases were searched for the methylation status of the 26 imprinted DMRs in the leiomyoma and myometrium. White and black boxes indicate hypomethylation or hypermethylation in the leiomyoma (more than 15% compared with the myometrium), respectively. The gray boxes indicate that the difference in the methylation rate between the leiomyoma and myometrium is less than 15%.

