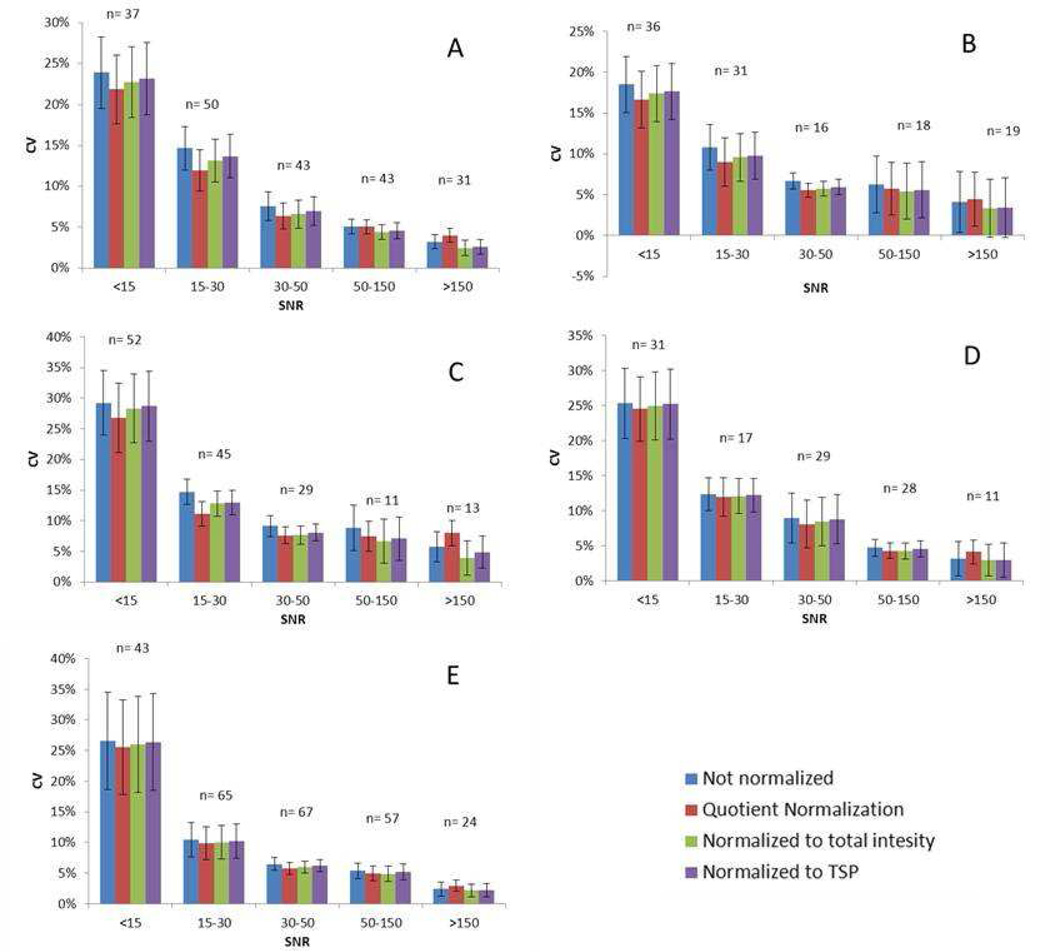
Figure 1.
Graph showing the average CVs for the five SNR ranges for the five different synthetic urine samples that were investigated. Samples 1 – 5 are A – E, respectively. Error bars show the confidence intervals (CI) of the CV contained in that SNR range. CI was calculated by xm ± 1.96×sm, and xm is the mean of the data and sm is mean standard deviation.

