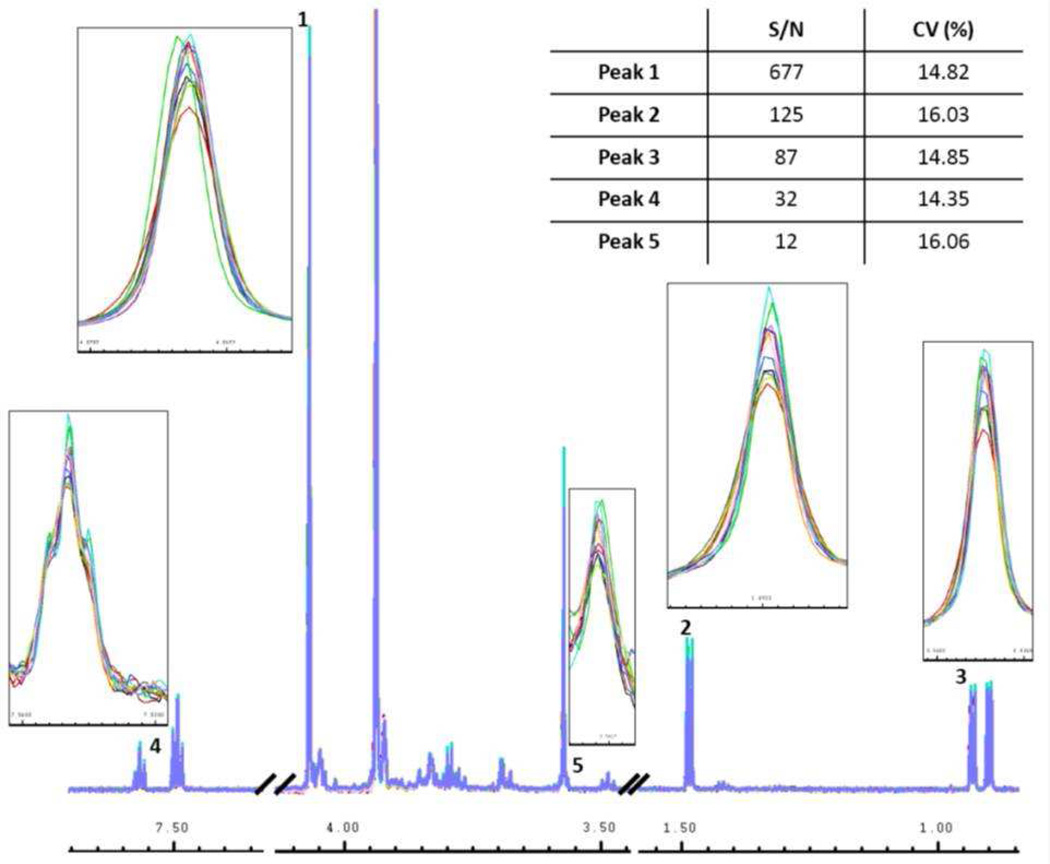
Figure 4.
Overlay of all 12 spectra of synthetic urine sample #2 with the peaks marked 1–5 containing a peak from approximately each S/N range shown in Figure 1. The insets show a zoomed in look of each peak to illustrate magnitude of the variation occurring in each peak. The inset table shows the SNR of each peak and its corresponding CV.

