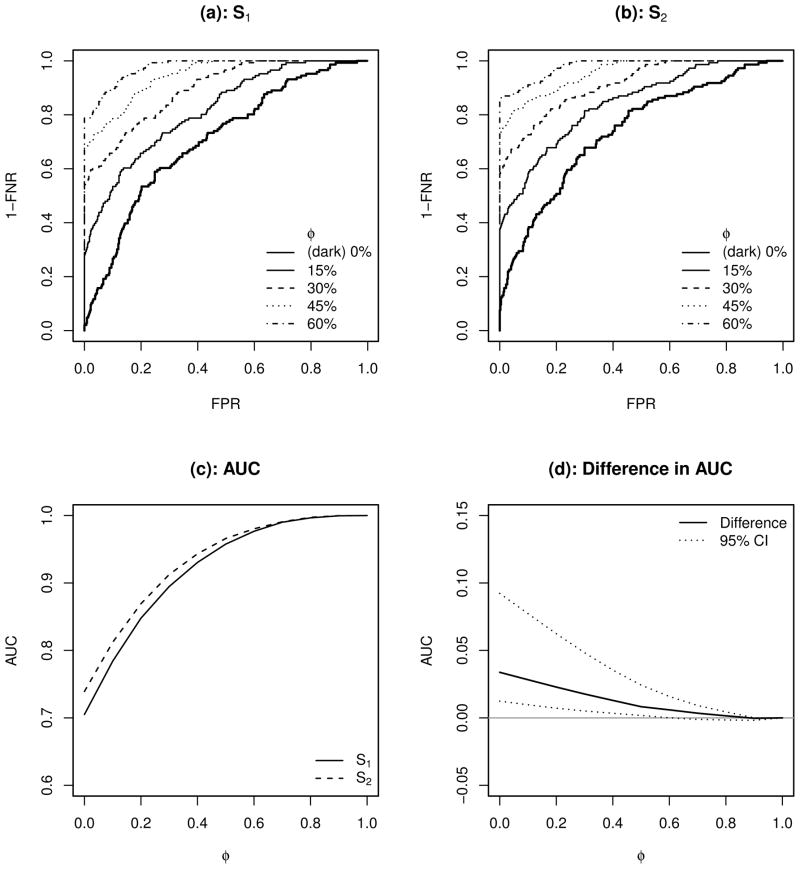
Figure 6.
ROC curves for diagnostic rules using S1 and S2 (subplots (a) and (b)); the resulting AUC curves as functions of φ (subplot (c)); and the difference of the two AUC curves (S2 “minus” S1, subplot (d)). The point-wise 95% CI of the difference in AUC is calculated using the bootstrap method with 500 re-samples.

