
Fig. 2.
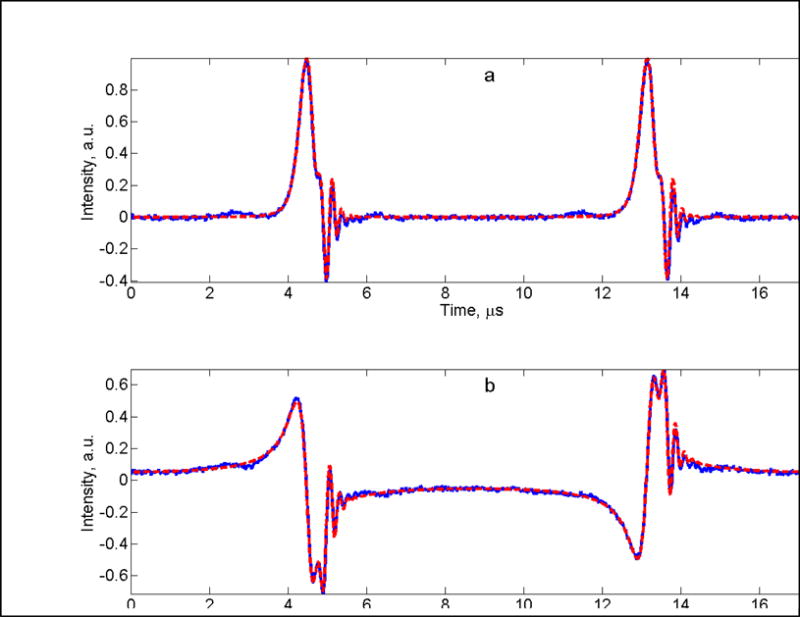
Simulation
 of experimental X-band rapid-scan spectrum
 of the low-field nitrogen hyperfine line for the nitroxide 15N-mHCTPO in water obtained with Bpp = 10.43 G, fm = 57.454 kHz, and incident power = 21 mW (B1 = 0.06 G) (a) absorption and (b) dispersion. The scan rate in the center of the sinusoidal scan is 1.9 MG/s.