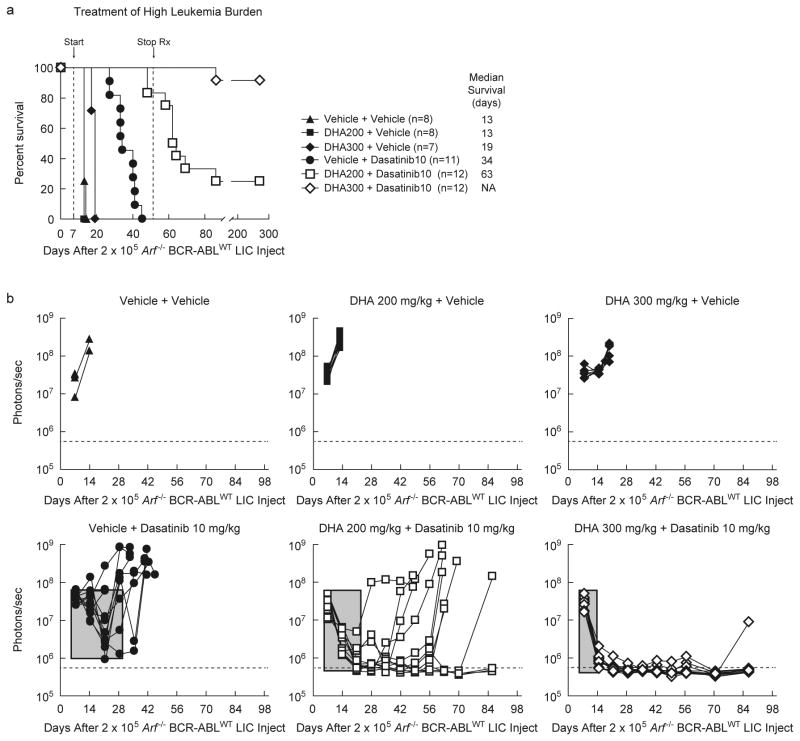
Figure 4. Dihydroartemisinin works synergistically with dasatinib to cure Ph+ ALL.
(a) Kaplan-Meier survival curves showing the survival benefit in response to therapy in IL-7+/+ Bl6 host mice that received day 0 tail vein injection of 2×10⁵ Arf -/- BCR-ABLWT Luc+ LICs. On day 7, six mouse groups bearing high burdens of BCR-ABLWT-driven leukemia were started on daily treatment for 5 days of each week, using two-dose regimens - 2 vehicles or 1 vehicle and 1 agent or 2 agents (see label), with 2 doses of each regimen given separately, 8 h apart, by oral gavage. On day 52, all therapy was terminated. (b) For 6 mouse groups in (a), separate graphs represent quantitative assessment of serial whole-animal luminescent signals (p/s/cm2/sr) acquired weekly. Solid lines represent imaging intensity of signal (y-axis) as a measure of leukemia burden from individual mice in the group, which is traced in real time on the x-axis. On day 7, before initiating therapy, all 6 groups had comparable and high burden of leukemia. The horizontal dotted line represents the empirically determined lower limit of sensitivity for luminescent signal as an experimental cut-off for detectable levels of persistent leukemia. Rectangular gray box quantifies experimental primary therapeutic response to indicated regimens; box-width depicts approximate time (days) to induce maximal initial response and box-depth represents maximal decrease achieved in leukemia burden signal. Increasing depth and decreasing width indicate stronger and quicker primary responses, respectively.

