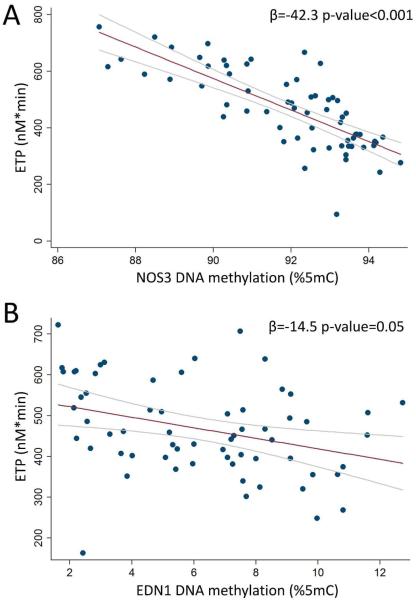
Figure 1. Associations of NOS3 (A) and EDN1 (B) blood DNA methylation with Endogenous ETP.
The scatterplot shows the mean methylation values [between measures at sample1 and sample 2] of the CpG sites measured at each gene sequences.
Regression coefficients (β) and corresponding p-values adjusted for age, BMI, current smoking status (yes/no), NSAID, and % monocytes are reported. The regression coefficients express the effect on ETP estimated for one unit increase in NOS3 and EDN1.

