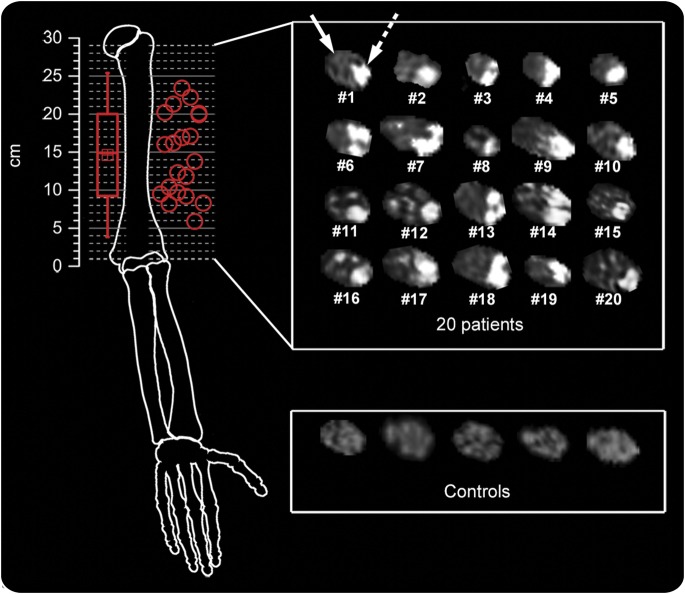
Figure 1. Fascicular lesions of median nerve at upper arm level in anterior interosseous nerve syndrome.
Spatial (red circles, upper left) and statistical (red box-and-whisker plot, upper left) distributions of predominant individual lesion sites and array of individual median nerve cross-sectional magnetic resonance neurography images (upper right) for the patient group (n = 20, numbered in accordance with table e-1). Localization of individual lesion sites is given as distance in cm from humeroradial joint space (at 0 cm). Differences in individual arm lengths were not corrected for. In all patients, strongly increased T2 signal (bright) was found within a group of fascicles whereas other fascicles were spared, indicated by dashed (lesion) and solid (normal fascicles) white arrows in patient 1. Nerve T2 signal was normal in controls (lower right showing 5 representative out of 20 control subjects).

