
Figure 2. Somatotopy of fascicular T2 median nerve lesion on individual level, group level, and atlas.
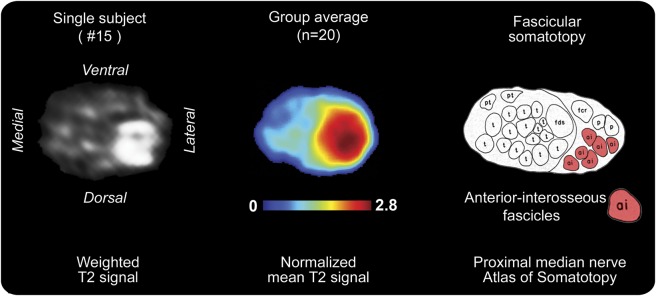
On the left, the T2-weighted source image of the median nerve of patient 15 is shown for the site of predominant lesion focus (17.1 cm proximal to humeroradial joint). Anatomical orientation is given by labeling ventral/dorsal/medial/lateral contours. In the middle, a spatial map of the patient group mean normalized T2 signal is shown. This map was rendered after segmentation and intersubject image registration. On the right is a somatotopic/topographic internal map of fascicles of the median nerve trunk. This schematic drawing was obtained by Jabaley et al.31 from tracing extraneural median nerve branches from distally to intraneural proximal fascicles within the median nerve trunk on 20-μm-thick cuts after intraneural microsurgical dissection and histologic photographing (modified from Jabaley et al.31 with permission). On this map, the red fascicles (“ai”: anterior-interosseous) are in close spatial arrangement with the T2 lesion focus on individual (left) and group level (middle). This cross-sectional lesion area is at the dorsal and lateral/radial aspect of the median nerve at upper arm level with a mean distance of 14.6 ± 5.4 cm proximal to the humeroradial joint space.