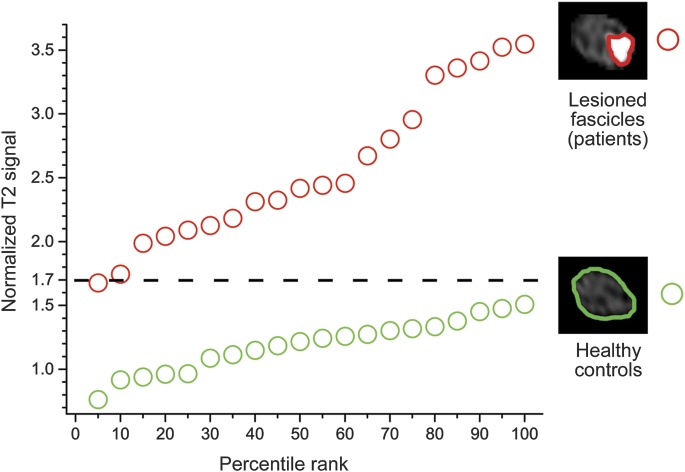
Figure 4. T2 signal analysis of median nerve trunk fascicles at upper arm level.
The upper graph (red) visualizes ordered percentile ranks of normalized T2 signal of each individual fascicular median nerve T2 lesion of the patient group (n = 20, red circles). The lower graph (green circles) visualizes percentile ranks of median nerve normalized T2 signal of the control group (n = 20). Perfect discriminative power to separate patients with anterior interosseous nerve syndrome from controls was observed at a cutoff value of ≥1.7 of normalized T2 signal. The complete separation of both distributions corresponds to 100% sensitivity and 100% specificity. Manual segmentation of lesioned fascicles (patients) and normal median nerves of healthy controls was performed as indicated by red and green regions of interest on the right side of the diagram.

