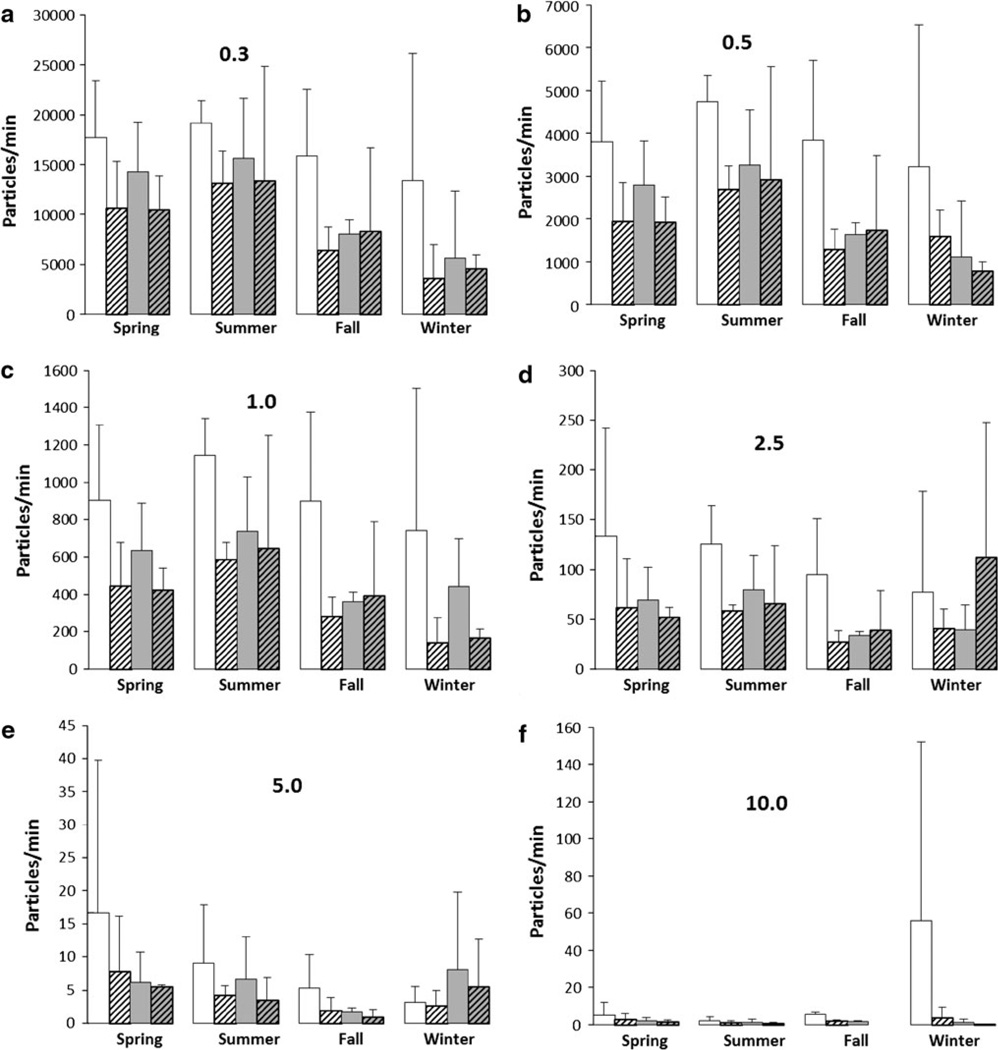
Figure 1.
Particles produced while inside (white) or outside (gray), performing sweeping (hatched) or walking (clear), throughout each season in central and southwest Montana 2011–2012. Numbers represent mean (±SD) number of particles produced per minute for each size category (0.3, 0.5, 1, 2.5, 5 and 10).

