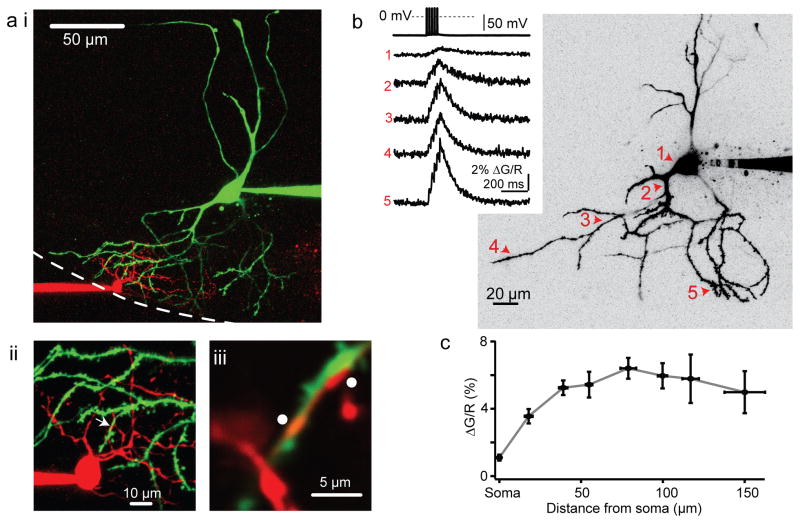
Figure 3. Fusiform cell action potentials propagate into the distal apical dendrites.
a-i) 2-photon maximum-intensity z-stack from the example in Figure 1b. The stellate and fusiform cells are filled with Alexa594 (red) and Alexa488 (green) dyes, respectively. Dotted white line represents the approximate ependymal border of the DCN. Stellate cell processes do not extend into the cell body layer, whereas fusiform cell processes span the entire length of the DCN.
a-i) A maximal intensity z-stack at higher magnification from the same pair.
a-iii) High magnification, single optical section of the area denoted by the white arrow in panel (b), showing a high degree of overlap between the stellate and fusiform cell processes (white dots).
b) Right: Maximum intensity 2-photon z-stack from a representative fusiform cell showing line scan locations during the Ca2+ imaging experiment. Left: Example sweeps of action potential-evoked Fluo-5f Ca2+ transients (5 spikes, 50 Hz) recorded at the corresponding dendritic locations marked in the z-stack on the left. Each trace is an average of 20–25 trials.
c) Absolute ΔG/R plotted as a function of approximate distance from the soma. Response amplitudes remain relatively constant along the dendrite. Each data point represents mean values ± s.e.m. from 3 to 6 individual cells.

